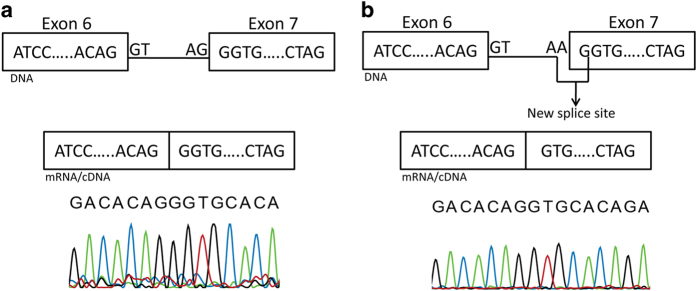
Figure 5.

Schematic representation of the effect of the splice acceptor site mutation c.413-1G > A on CNGB1 messenger RNA. cDNA sequence from a construct obtained from control DNA is indicated in panel a, whereas cDNA from a construct bearing the IVS6-1G > A mutation is shown in panel b.
