
Figure 3.
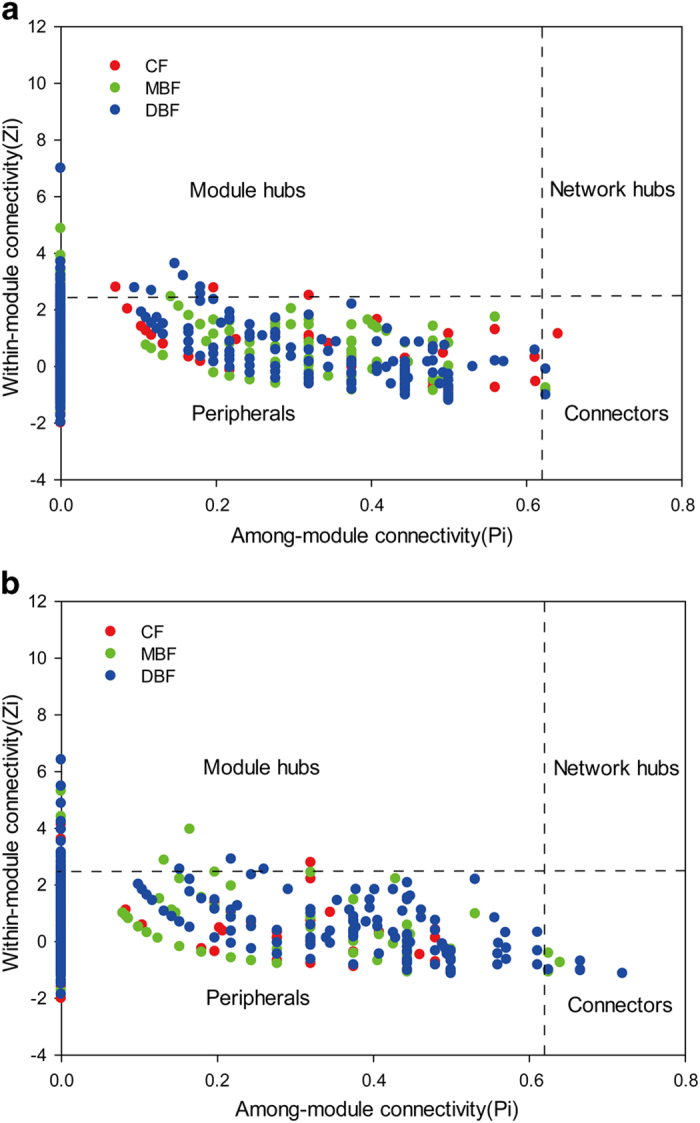
Z-P plot showing the distribution of functional genes involving in carbon (a) and nitrogen (b) cycling based on their topological roles. Each color represents a kind of forest type, respectively CF (red), MBF (green) and DBF (blue). The topological role of each gene was determined according to the scatter plot of within-module connectivity (Zi) and among-module connectivity (Pi).