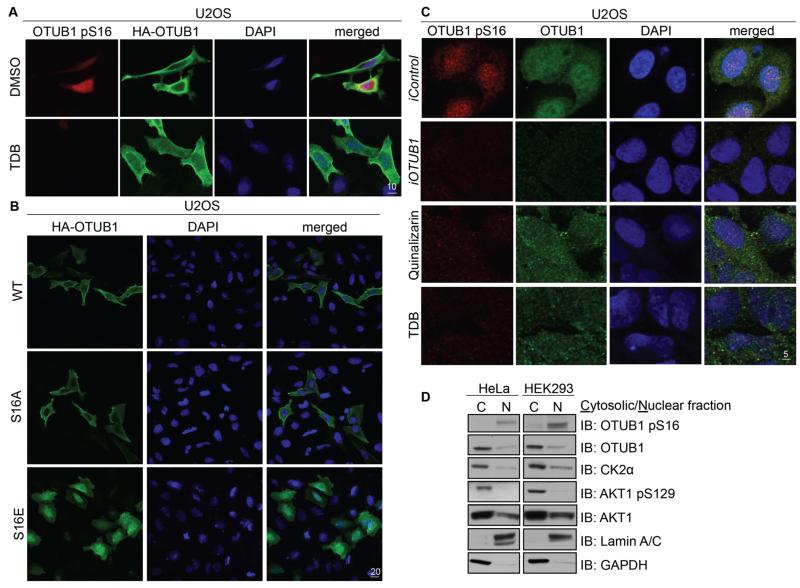
Figure 5. OTUB1 phosphorylation at Ser16 determines its subcellular localization.
(A) Fixed cell immunofluorescence in U2OS cells transfected with HAOTUB1 and untreated or treated with TDB (10 μM, 4 hours). Individual and merged images show phosphorylated OTUB1 pSer16 (red), OTUB1 (HA, green) and DAPI (blue). Scale bar, 10 μm. (B) As in (A) in U2OS cells transfected with HA-OTUB1, HA-OTUB1[S16A] or HA-OTUB1[S16E]. Scale bar, 20 μm. (C) As in (A) in U2OS cells 48 hours after RNA interference [iOTUB1 or iControl (FOXO4)] or after treatment with CK2 inhibitors quinalizarin (10 μM, 4 hours) or TDB (10 μM, 4 hours). Scale bar, 5 μm. (D) Western blotting (IB) for the indicated proteins in cytosolic and nuclear fractions from HeLa or HEK293 cells. All data are representative of 3 independent experiments.

