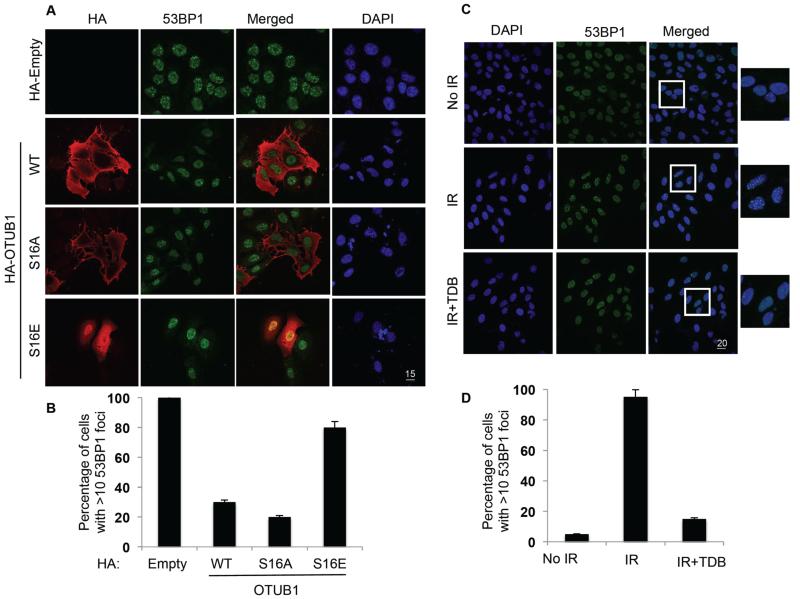
Figure 6. The phosphorylation and nuclear localization of OTUB1 promotes IR-induced 53BP1 foci formation.
(A) Fixed cell immunofluorescence for OTUB1 localization and 53BP1 foci in U2OS cells transfected with HA-tag (HA-Empty), wild-type (WT) or mutant (S16E or S16A) HA-tagged OTUB1, then exposed to 5 Gy IR and fixed 3.5 hours later. Scale bar, 15 μm. (B) Quantification of cells displaying more than 10 53BP1 foci from each condition in (A). (C) Fixed cell immunofluorescence in U2OS cells exposed to 5 Gy IR alone or treated with TDB (10 μM, 4 hours) prior to IR exposure. Individual and merged pictures are shown displaying 53BP1 foci formation in green and DAPI in blue. Scale bar, 20 μm. (D) Quantification as in (B). Images are representative, and data are mean ± S.D. from 3 experiments, at least 33 cells quantified in each.

