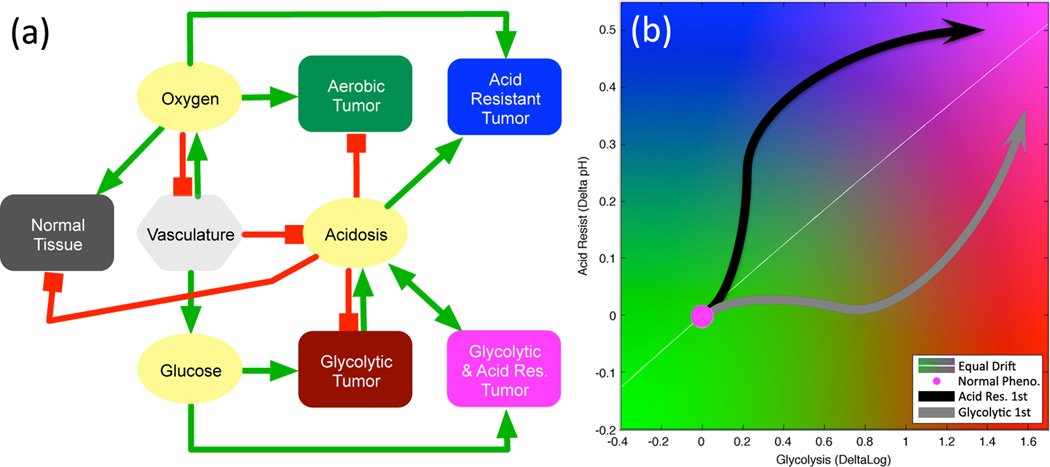
Figure 2.
(a) Model interaction network for diffusible molecules (yellow), vasculature (light gray) , normal tissue (dark gray), and variable tumor phenotypes (colors). Red lines show negative or inhibitory interactions and green lines show positive or productive interactions. (b) A flow map of tumor phenotype space. The horizontal axis is the constitutively activated log-glycolytic capacity (log pG), and vertical axis is the change in acid resistance (−ΔβT) from normal, with higher resistance to acidic conditions being higher on the plot. The normal metabolic phenotype is at the origin (magenta circle), while the arrows represent two possible routes to reach the aggressive state of high glycolysis and high acid-resistance, as discussed in section 3.1. The white line shows the equal maximal variation, such that a cell acquiring maximal positive changes in glycolytic capacity and acid-resistance on each division would move along this line in phenotype space.

