Figure 4.
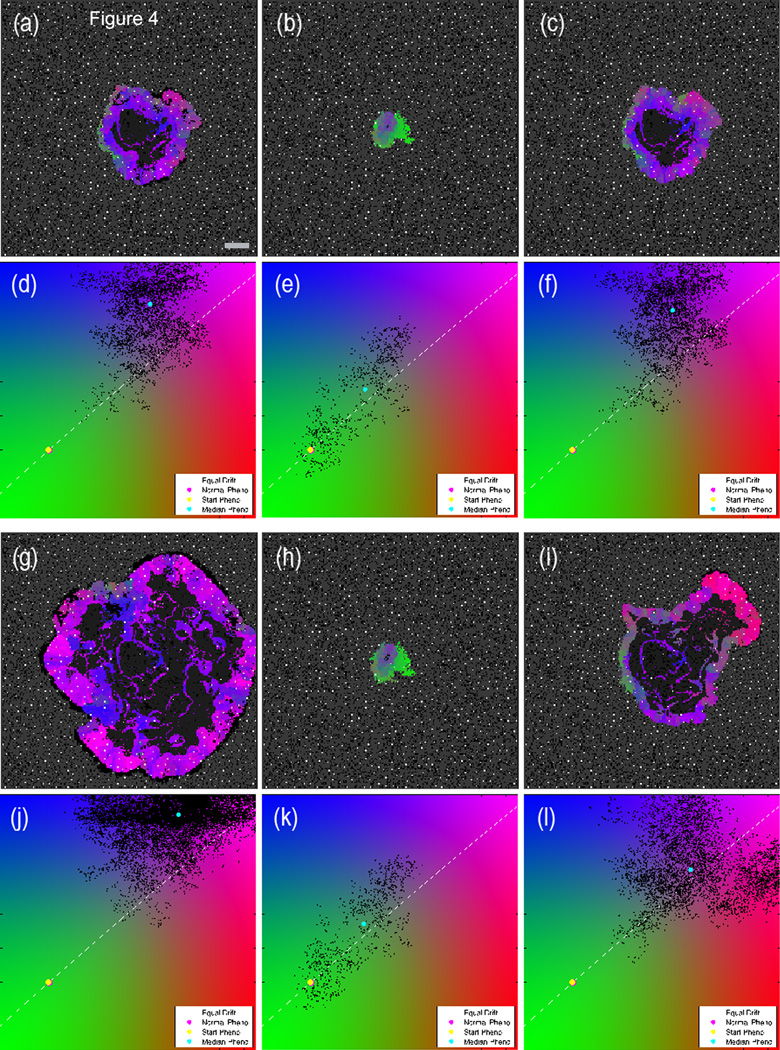
Comparison of three pH buffering simulations with identical initial conditions at two different time points. The left column is an untreated simulation; the central column is continuously treated with sodium bicarbonate starting at trel=0 days; the right column starts treatment at trel=75 days. The top panels (a–f) show the state of the three simulations at trel=78 days, i.e. shortly after the tumor in the right column has started the buffer therapy. The bottom set of panels (g–l) shows the state of the tumors at trel=142 days. Scale bar is 400 microns. Video available on the online supplemental section (Video 2).

