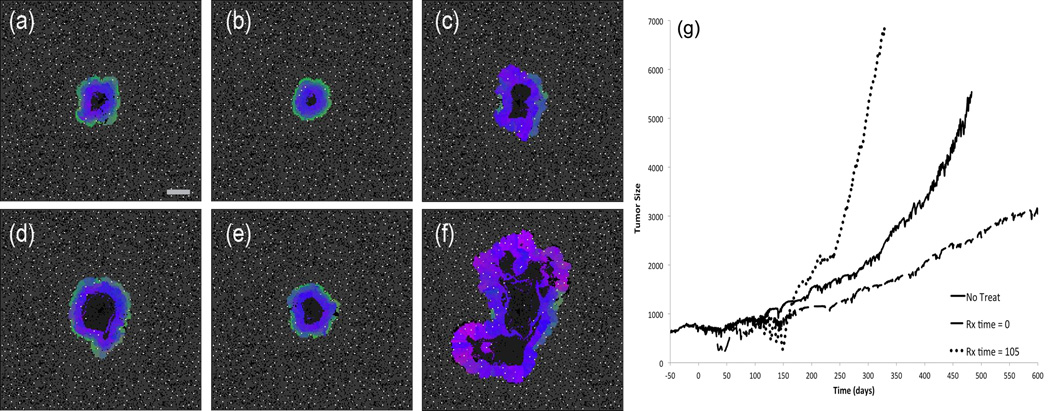
Figure 6.
(a–f) Comparison of untreated and chemotherapy simulations with identical initial conditions at two different time points. The left column is an untreated simulation; the central column was pulsed with cytotoxic therapy starting at trel=0; the right column starts the identical treatment at trel=105. The top panels (a–c) show the state of the three simulations at trel=264, i.e. shortly after the tumor in the right column has finished the therapy. The bottom set of panels (d – f) shows the state of the tumors at trel=380. Scale bar is 400 microns. Video available on the online supplemental section (Video 4). (g) Growth curves for untreated (solid), early (dashed), and late (dotted) chemotherapy from (a–f). Tumor size on the vertical axis is the diameter in microns.

