
Figure 3.
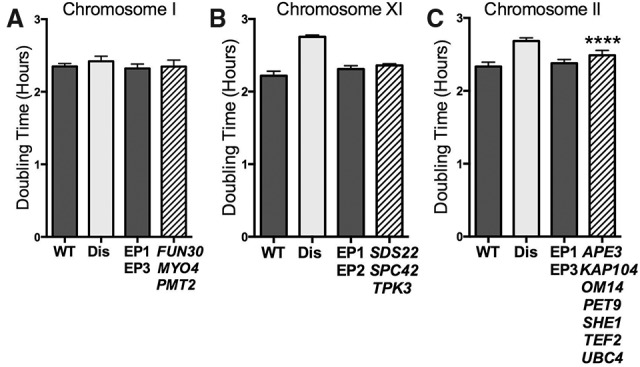
Effects of DSGs[20] on cell proliferation. (A–C) Cells were grown as described in Figure 1. Genes were grouped into graphs according to their chromosomal location. Dark-gray bars represent control strains carrying empty plasmids, light-gray bars represent the corresponding disomic strain (Dis), and striped bars represent DSG plasmid-containing strains. Empty vector CEN plasmid controls were EP1-TRP1, EP2-HIS3, and EP3-LEU2. SD is shown. (****) P < 0.0001; Student's t-test. The strains used, in order, were A22361, A12683, A36954, and A36922 (A); A22361, A28266, A36953, and A36939 (B); and A22361, A12685, A35954, and A36925 (C).