
Figure 3.
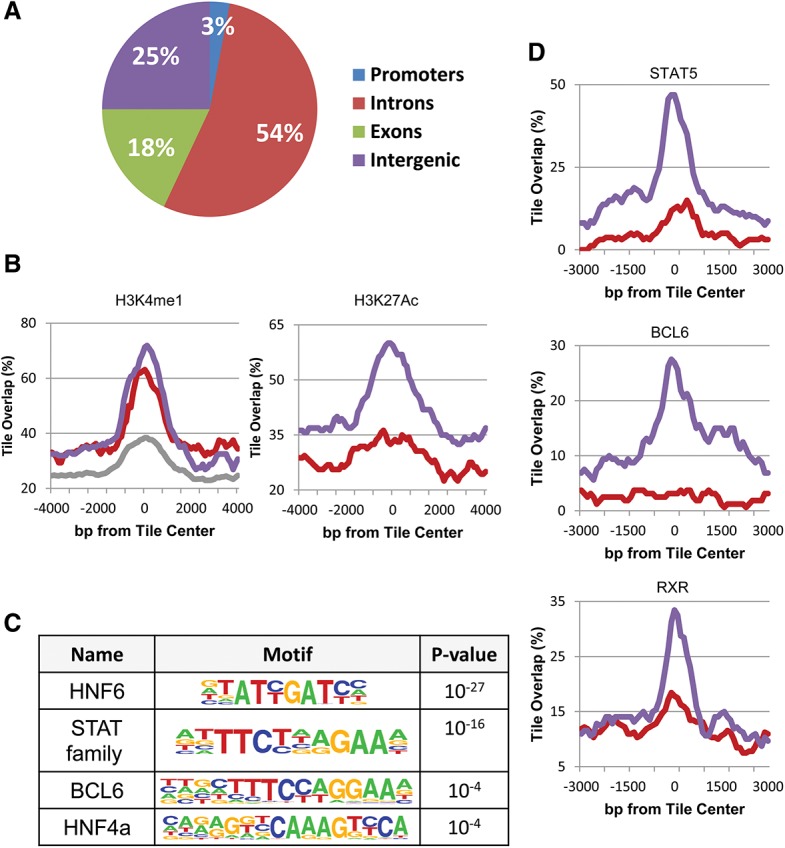
Enhancer regulation. (A) Genome distribution of demethylated regions (as determined by RRBS). (B) ChIP-seq (as adapted from Rosenbloom et al. 2013; Sugathan and Waxman 2013) of demethylated regions (RRBS) as a function of distance from their center tile for H3K4me1 and H3K27Ac in male (blue), female (red), and a mixture of other tissues (grey). (C) Motif analysis of demethylated regions as determined by WGBS. (D) ChIP-seq data of demethylated regions (RRBS) for transcription factors in male (blue) and female (red) liver DNA samples were adapted from the literature (Zhang et al. 2012; Kosters et al. 2013) and normalized as described in the Materials and Methods. Similar results for A, B, and D were also obtained using data from WGBS (data not shown).