
Figure 2.
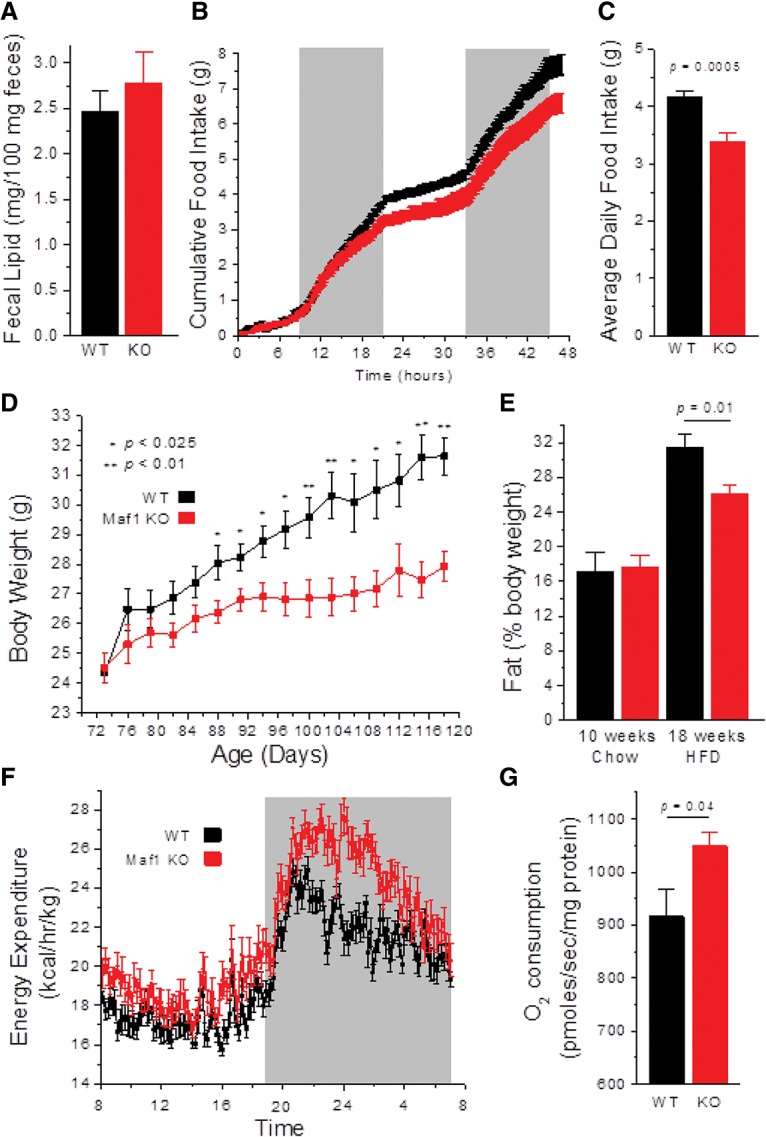
Hypophagia and metabolic inefficiency of Maf1−/− mice. (A) Fecal lipid content of chow-fed mice (n = 4 per group). (B) Two-day cumulative food intake of weight-matched chow-fed mice (n = 4 per group). (C) Daily food intake of weight-matched mice averaged over 5 d. (D) Body weight curves of pair-fed mice on a HFD (n = 5 per group). (E) Percent body fat before and after 8 wk of HFD pair feeding (n = 5 per group). (F) Energy expenditure in HFD pair-fed animals (24-h averages over 5 d in metabolic cages; n = 4 per group; mice were 18 wk of age). (G) Oxygen consumption from mitochondrial complex 2 was measured on liver homogenates from HFD-fed mice (n = 8 per group). (Black) Wild-type (WT); (red) Maf1−/− (KO). All values are presented as the mean ± SEM.