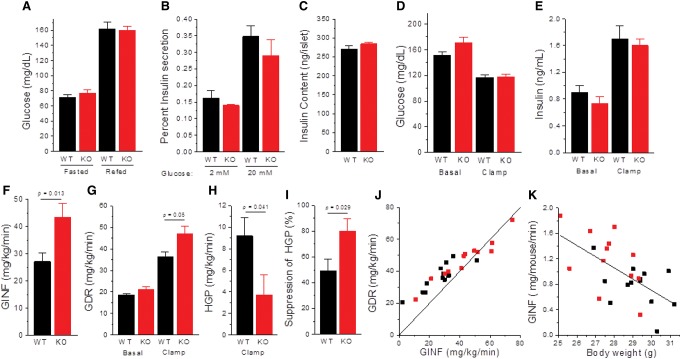
Figure 3.
Blood glucose, insulin secretion, and analysis of insulin sensitivity. (A) Blood glucose concentrations were determined from tail vein bleeds after an overnight fast and following a 4-h refeed. Mice were 4 mo of age and were maintained on a breeder chow diet. (n = 7 mice per group). (B) Insulin secretion ex vivo was assayed in the presence of 2 mM and 20 mM glucose (five islets per well; n = 8 per condition per genotype; chow diet). Results are expressed as a percentage of the total insulin content of the islets used in the assay. (C) Insulin content of islets was calculated from five islets per sample (n = 16 per group). (D–K) Hyperinsulinemic–euglycemic clamp analysis of insulin sensitivity in 5-h-fasted mice. (D) Plasma glucose levels before and during the clamp. (E) Plasma insulin levels before and during the clamp. (F) Glucose infusion (GINF) rate needed to maintain euglycemia. (G) Glucose disposal rate (GDR) before and during the clamp was measured by the tracer dilution technique using [3-3H]glucose as tracer. (H) Hepatic glucose production (HGP) during the clamp. (I) Suppression of hepatic glucose production was calculated as the difference in HGP in the basal state (=basal GDR) and during the clamp divided by the basal HGP. (J) Rates of glucose disposal versus glucose infusion are shown for all of the mice in the study relative to a line with a slope of 1. HGP is the vertical difference between each data point and the line. (K) Glucose infusion rate (insulin sensitivity) is inversely correlated with the body weight of the mice. A linear fit is shown to all of the data. All values are presented as the mean ± SEM. Clamp data in D–K were obtained from 13 wild-type and 12 Maf1−/− mice. (Black) Wild type (WT); (red) Maf1−/− (KO).

