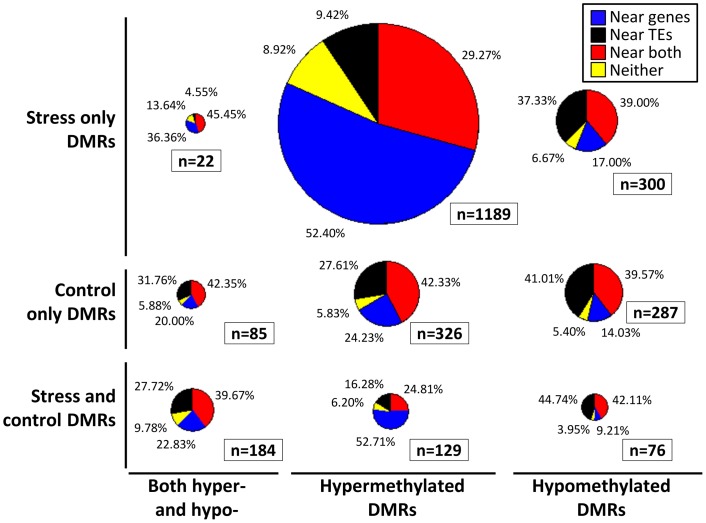
Figure 3.
Location of DMRs relative to genes and TEs. Each DMR was classified based on whether it exhibits hypomethylation, hypermethylation, or both hypo- and hyper-methylation relative to the control average (x-axis). The DMRs were also classified based on whether they exhibit significant differences in stress samples only, control samples only, or both control and stress (y-axis). Proportionally sized pie-charts are used to illustrate the frequencies of DMRs located near (<500 bp) genes (blue), TEs (black), both genes and TEs (red), or neither (yellow).

