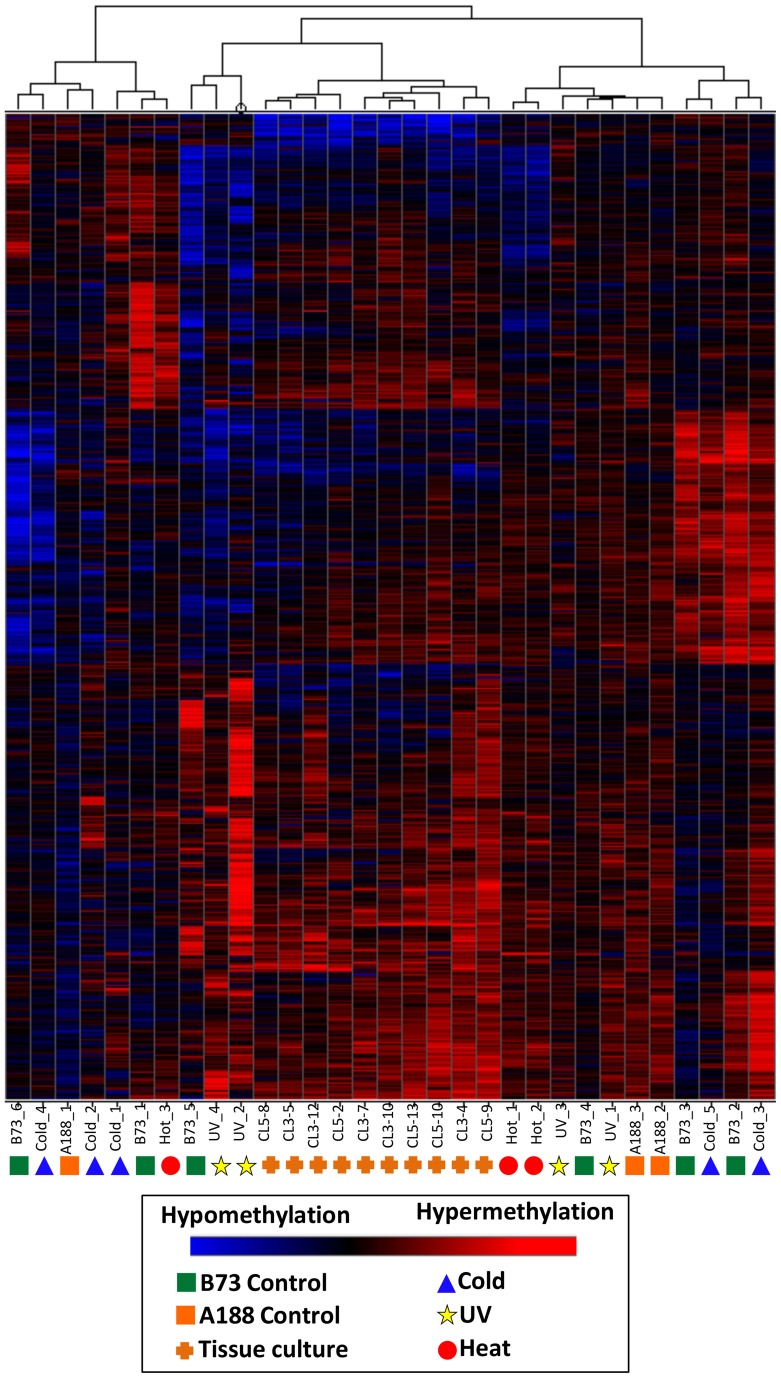
Figure 5.
Clustering of DNA methylation differences in plants subjected to abiotic stress or tissue culture. Hierarchical clustering (Wards method) was performed for the DMRs identified the analysis of individual plants subjected to abiotic stress or tissue culture. These DMRs are the subset that do not exhibit differences in B73 (used for abiotic stresses) relative to A188 (used for tissue culture). The heatmap uses red to indicate DNA methylation levels higher than the control average and blue to indicate lower DNA methylation levels. The samples are indicated at the bottom of each plot and the symbols indicate the treatment (green squares, B73 control; orange squares, A188 control; blue triangles, cold; red circles, heat; yellow stars, UV; orange pluses, tissue culture regenerants).

