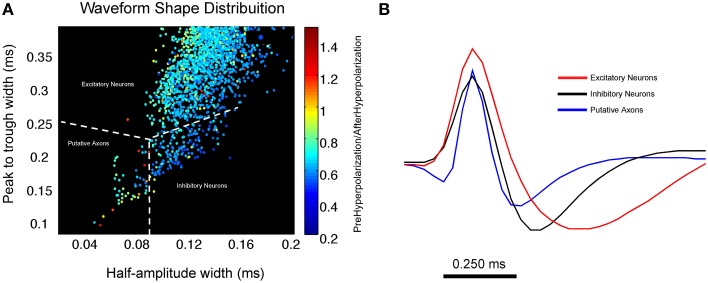
Figure 4.
Using waveform shape distributions to cluster excitatory, inhibitory and putative axonal activity in the medial prefrontal cortex. (A) Scatterplot of waveform distribution that plots peak-trough width against half amplitude width. Each data point represents an individual cell waveform that is color coded to reflect its pre-hyperpolarization and post-hyperpolarization ratio. The use of secondary waveform features in conjunction with spike duration allows for the reliable separation of 3 distinct clusters of excitatory and inhibitory neurons as well as putative axons. Inhibitory neurons tend to exhibit a larger half amplitude width as well as a lower pre-hyperpolarization/post-hyperpolarization ratio (shown in blue) when compared to putative axons. (B) Average waveform for all units in each cluster; excitatory neurons are shown in red, inhibitory neurons are in black, putative axonal activity is shown in blue. Average waveform of putative axons strongly resembles those described in Robbins et al. (2013) (Figure compliments of Dr. Nathan Insel; Dataset from Insel and Barnes, 2014).

