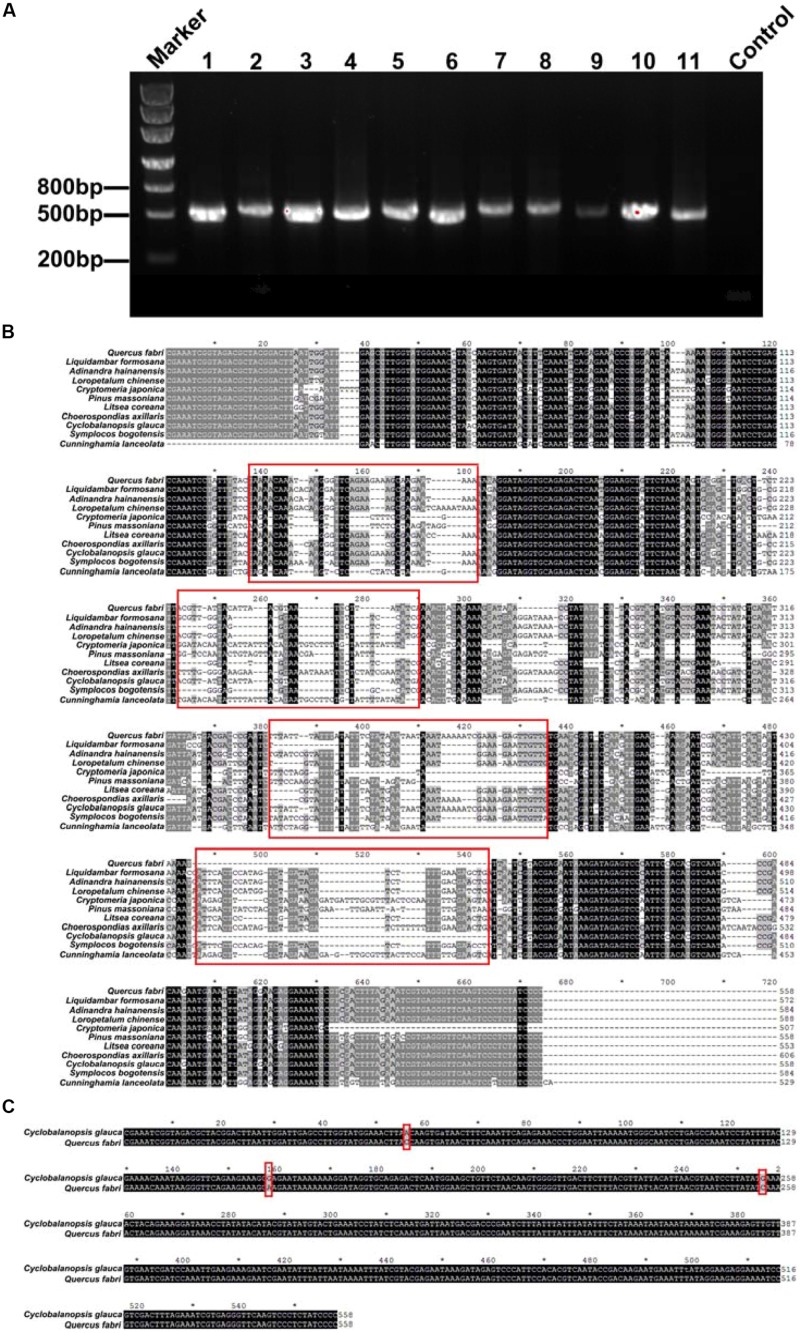
FIGURE 2.
(A) Electrophoresis graph of the polymerase chain reaction (PCR)-amplified plastid trnL(UAA) intron region. The numbers 1–11 represent different species (1- Quercus fabri, 2- Choerospondias axillaris, 3- Symplocos bogotensis, 4- Cunninghamia lanceolata, 5- Loropetalum chinense, 6- Litsea coreana, 7- Liquidambar formosana, 8- Pinus massoniana, 9- Cyclobalanopsis glauca, 10- Adinandra hainanensis, and 11- Cryptomeria japonica). (B) BLAST results of the plastid trnL(UAA) intergenic spacer/intron of the 11 different tree species; the red frames represent significantly different sequence spacers. (C) BLAST results of the plastid trnL(UAA) intron of C. glauca and Q. fabri.

