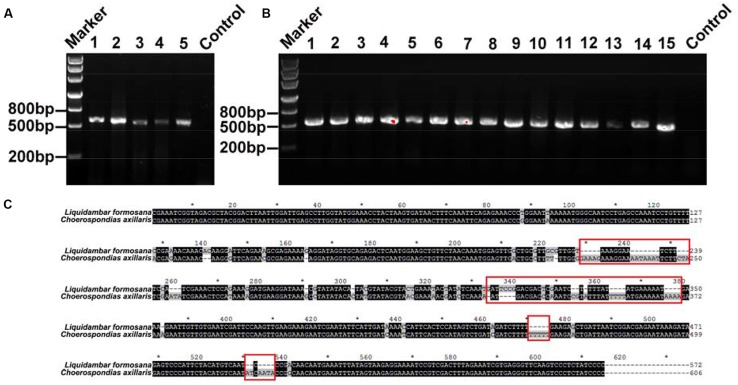
FIGURE 3.
(A) DNA gel graph of the PCR products from DNA of mixed samples consisting of two species. The number 1 stands for 0% of L. formosana sample, and 2, 3, 4, and 5 represent 25, 50, 75, and 100% of L. formosana samples, respectively. (B) The numbers 1–15 all denote positive PCR products for the 50% of L. formosana samples. (C) Blasting the sequences of L. formosana and C. axillaris; the red frames point to the obvious different sequence spacer electrophoresis picture of positive clone PCRs.

