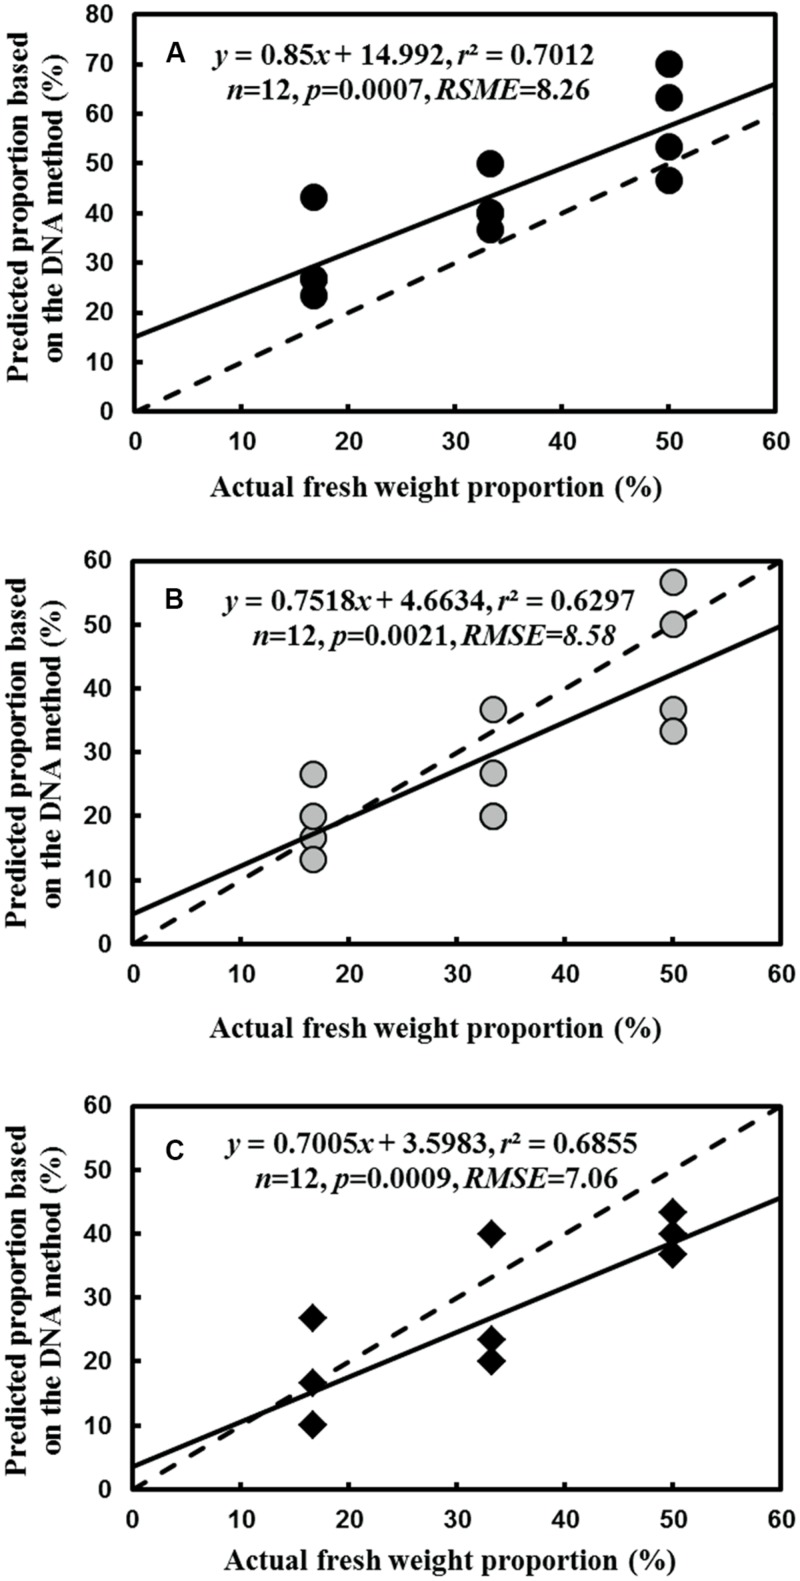
FIGURE 6.
Comparison of the predicted relative proportion based on the DNA method with the actual relative proportion of fresh weight for L. formosana(A), C. axillaris(B), and C. glauca(C) fine roots in mixed samples of the three species. The dash line represents one to one line and the solid line represents the regression line.

