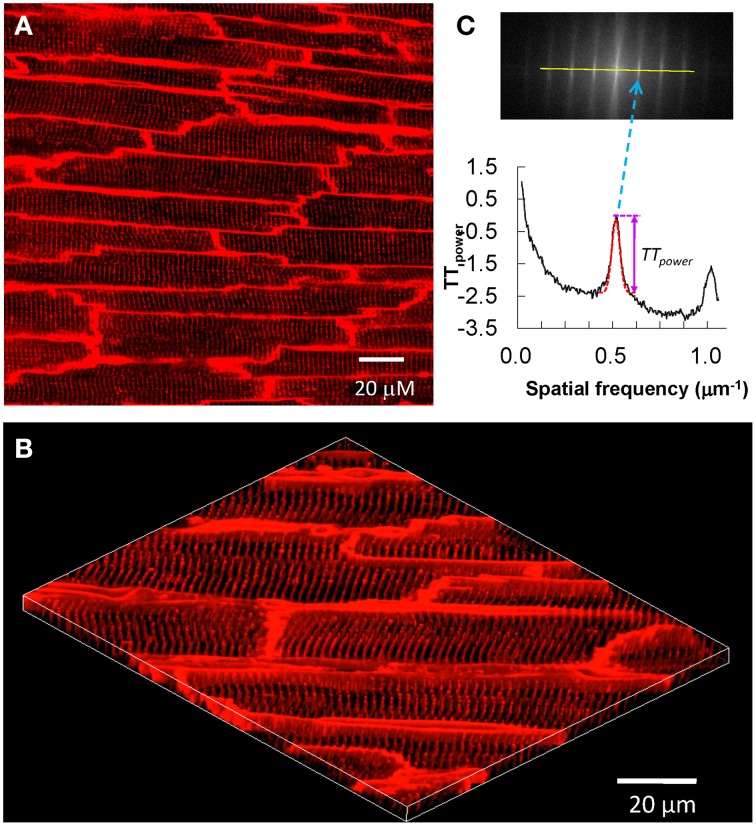
Figure 2.
In situ confocal imaging of T-tubules on intact rat heart and T-tubule image analysis. (A) A typical t-tubule image from the epicardium of Langendorff-perfused intact rat heart (control, sham-operated) loaded with lipophilic membrane indicator FM4-64. (B) The periodically organized T-tubules were viewed from a 3D reconstruction of 25 confocal stacks at 0.2 μm interval. Scale bar: 20 μm. (C) Power spectrum retrieved from a 2D Fourier transformation of T-tubule image characterized the power magnitude of the regular organization of T-tubule system. Data are adapted from Wei et al. (2010).

