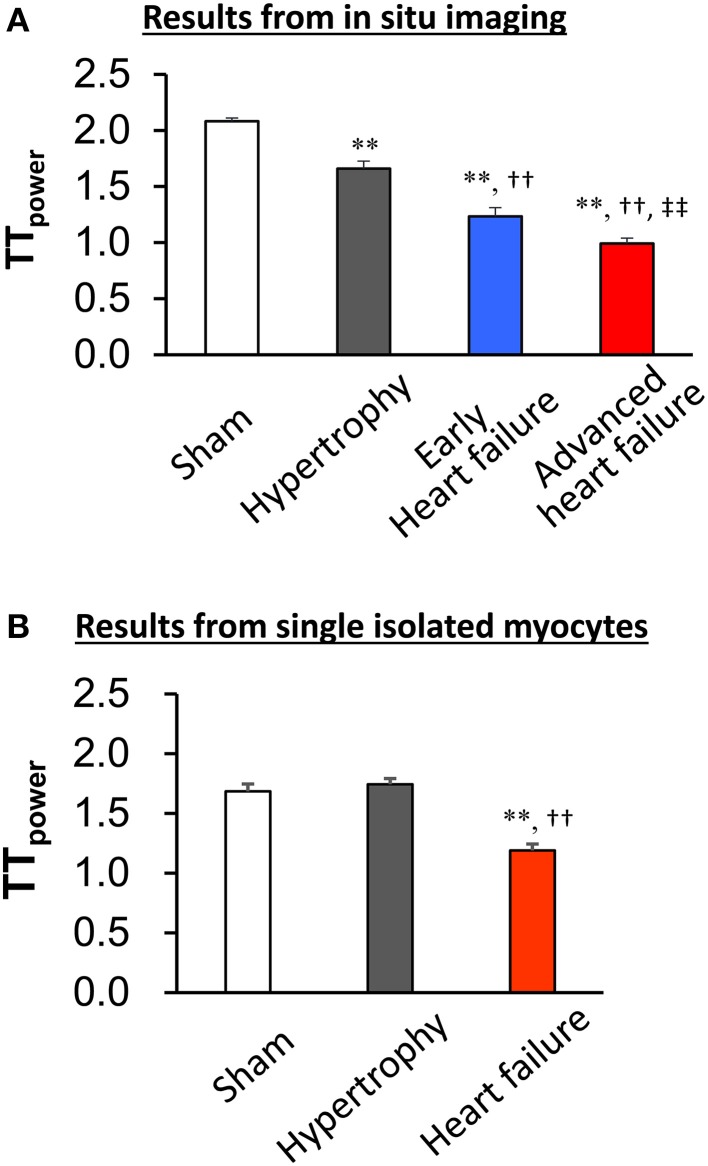
Figure 3.
In situ imaging reveals T-tubule damage in both compensated and decompensated hypertrophy (A). By contrast, the TTpower in isolated myocytes from sham and hypertrophied TAB hearts is similar (B), indicating that the isolation process results in damage to T-tubules. This damage prevents comparative quantitative analysis of T-tubule integrity following hypertrophy. **P < 0.01 vs. Sham, ††P < 0.01 vs. Hypertrophy, ‡‡P < 0.01 vs. Early heart failure, n = 5–8.

