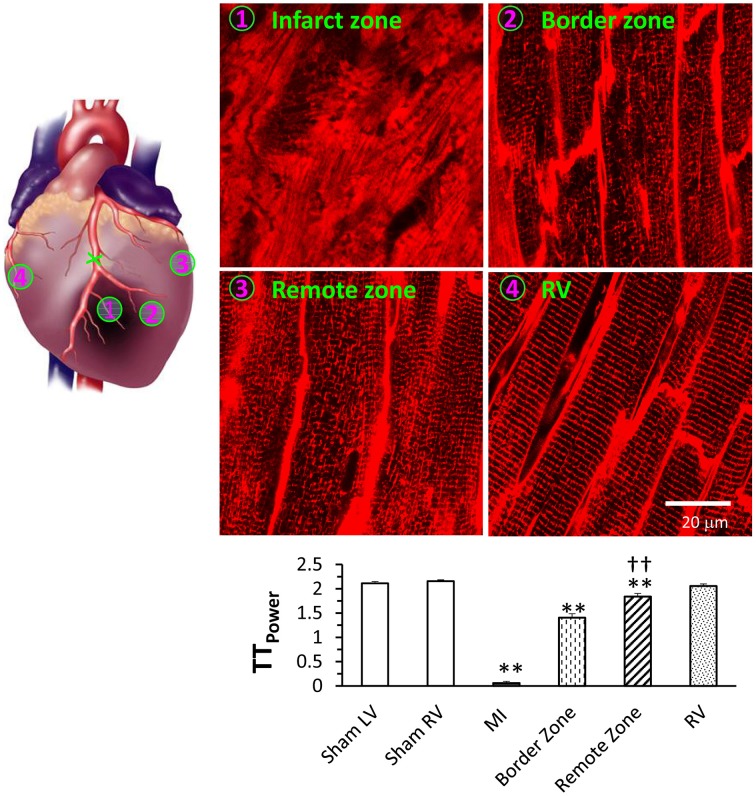
Figure 4.
Differential T-tubule remodeling in the border and remote zones relative to the infarct region as evidenced by in situ confocal imaging. Images from different regions of the same heart can be captured and quantitated to compare the extent of T-tubule damage these various regions. Representative T-tubule images were acquired from regions as indicated. Bottom panel shows average data of TTpower from different regions. **P < 0.01 vs. sham LV, ††P < 0.01 vs. MI border zone, P < 0.01 among groups. Data are adapted from Chen et al. (2012a).

