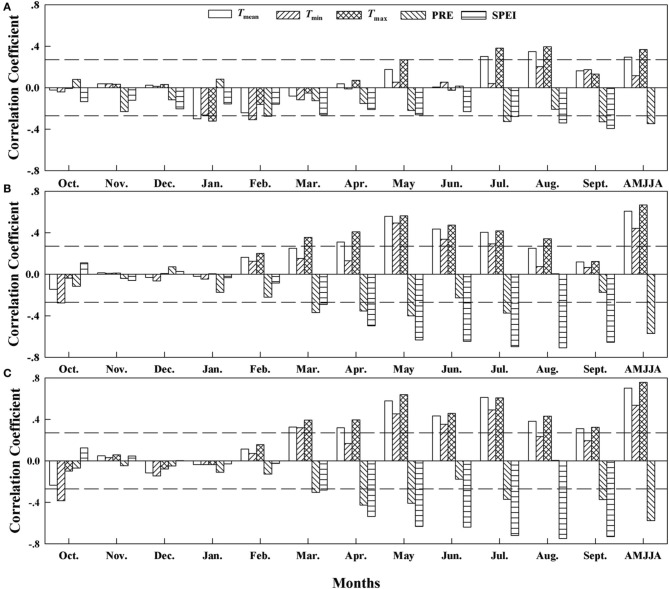
Figure 4.
Correlation coefficients (Pearson's r) between the δ13C residuals chronology and the climate variables from 1960 to 2010 at (A) Site A1 (2700 m a.s.l.), (B) Site A2 (2400 m a.s.l.), and (C) Site A3 (2200 m a.s.l.). Horizontal dashed lines represent the 95% confidence interval. Tmean, mean monthly temperature; Tmin, minimum monthly temperature; Tmax, maximum monthly temperature; PRE, total precipitation; SPEI, standardized precipitation evapotranspiration index. AMJJA represents the mean value from April to August.

