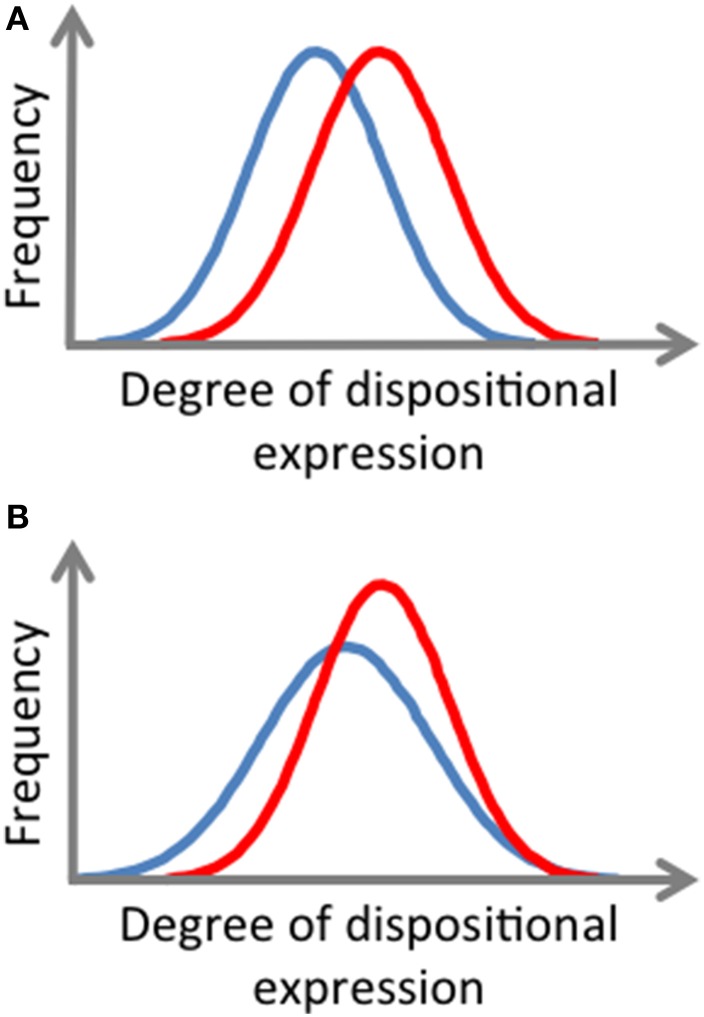
Figure 2.
Illustrative frequency distributions of momentary, cross-situational dispositional expressions displaying differences in degree of virtue possession. (A) The red curve displays a distribution representing a higher typical degree of virtue expression (higher mean score) than the blue curve. (B) The red curve represents a higher typical degree of (higher mean score), and more consistent (less variable), virtue expression than the blue curve.

