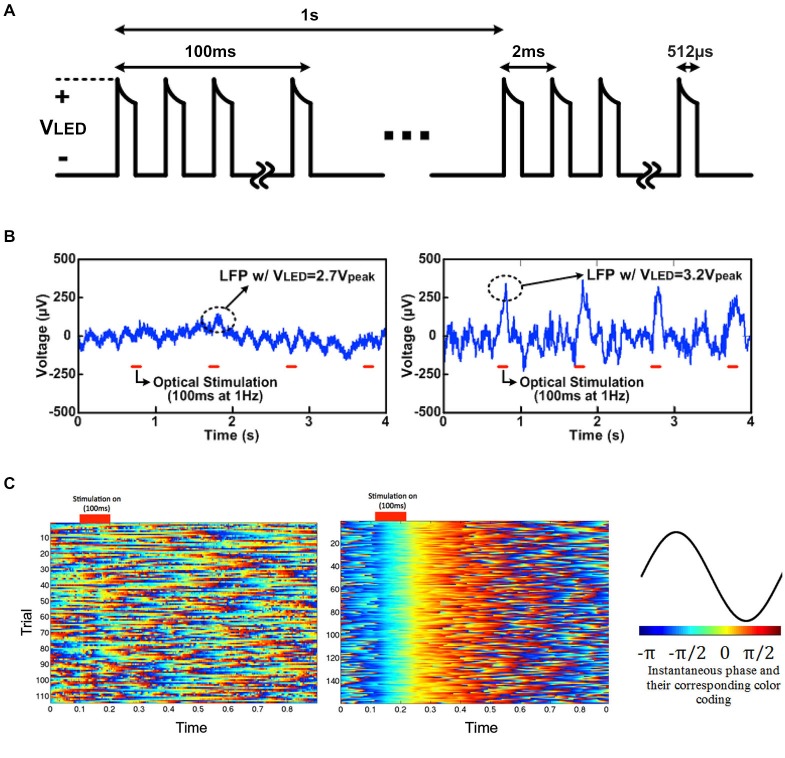
Figure 9.
Light-induced LFP recording driven by 2.7 Vpeak and 3.2 Vpeak for 100 ms: (A) LED driving voltage, VLED, for in vivo optogenetics with SCS, (B) light-induced local field potentials (LFP) with VLED = 2.7 Vpeak and 3.2 Vpeak, and (C) instantaneous phase with VLED = 2.7 Vpeak (top) and 3.2 Vpeak (bottom) in low frequency band (1–25 Hz), and their corresponding color-coding.

