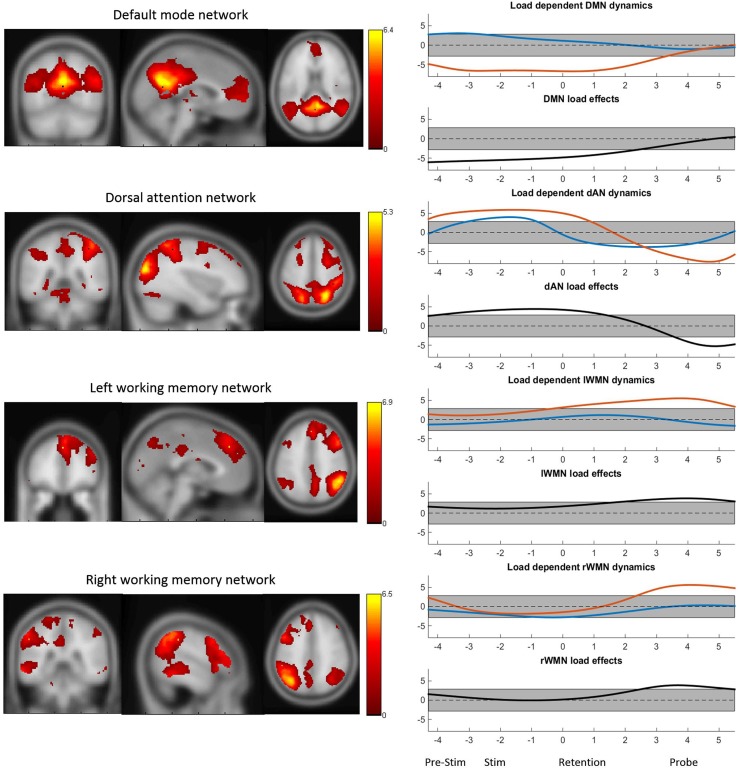
Figure 3.
The four TCNs and their activity over the task for high- and low-load conditions. The plots on the right show the t-statistics (across subjects) of the z-transformed TCN percent activity over the mean task conditions for low-load (blue) and high-load (red) conditions and t-test between high- vs. low-load conditions. Y-axes represent t-values and the gray bar represents the significance-threshold. The x-axis represents the time in seconds: −4 to −2.2: pre-stimulus; −2.5 to 0: stimulus; 0 to 3.5: retention; 3.5 to 5.5: probe; 5.5 to 5.8 and −4 to −2.5: pre-stimulus. 0 marks the beginning of the retention period.

