Figure 5.
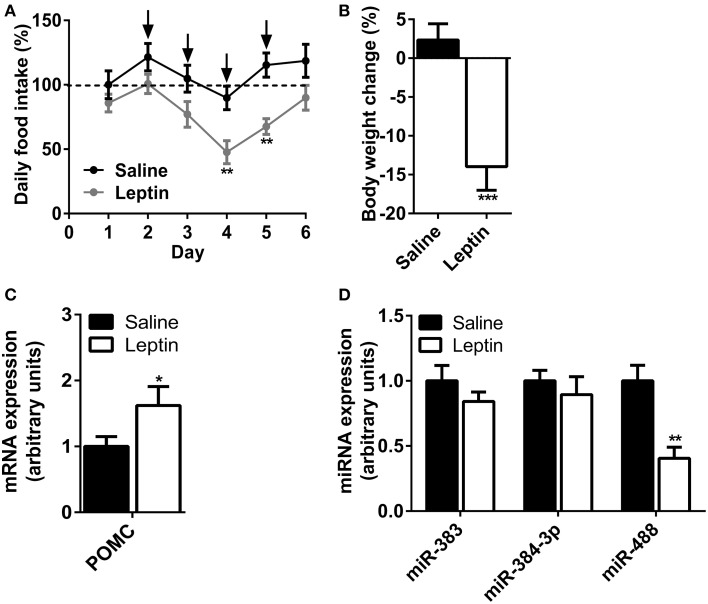
Effect of leptin central administration on miRNA levels in the hypothalamus. (A) Daily food intake in saline-injected and leptin-treated mice at baseline (day 1 before injection) and with daily i.c.v injections of leptin (2.5 μg; days 2–5). (B) Effect of leptin treatment on body weight. (C) Hypothalamic POMC mRNA expression in i.c.v leptin-treated mice and saline-treated animals. (D) Hypothalamic mir-383, mir-384-3p, and mir-488 expression in i.c.v leptin-treated mice and saline-treated animals. Arrows indicate the injections. Values represent the mean ± SEM (n = 7). *P < 0.05, **P < 0.01, ***P < 0.001 vs. saline-treated animals.

