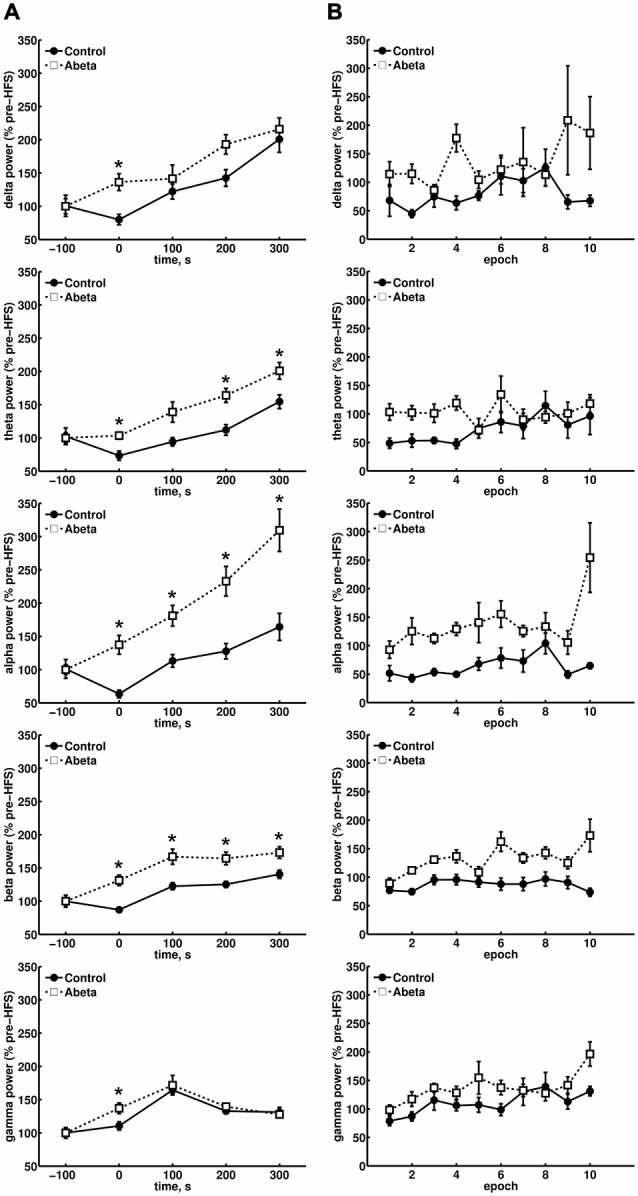
Figure 3.

Overview of relative spectral power for oscillations below 100 Hz for control and Aβ-treated animals. (A) Relative changes in spectral power for delta, theta, alpha and beta bands in control and Aβ-group before, during and 300 s after HFS comprising 500 s EEG analysis are shown. Each time-point contains the mean values of 10 epochs from 4.1 contiguous seconds of EEG data derived from spectral power analysis of the respective, pre-filtered frequency band. The power levels of the baselines for the respective frequencies did not differ significantly. The relative spectral power for all frequency bands in Aβ-treated animals showed significantly higher scores during HFS compared to controls (Wilcoxon-test: *p < 0.05). In addition, the relative theta, alpha and beta power also showed significantly higher relative power levels for the Aβ-group compared to controls. (B) The change in relative power levels for single epochs during HFS induction are shown, and demonstrate that a suppression of theta power at the beginning of HFS can be seen in controls that is followed by a gradual increase back to baseline values. This response profile is absent in the Aβ-group. Only control animals exhibit a suppression of the relative network power levels of all frequency bands at the beginning of HFS application.
