Figure 4.

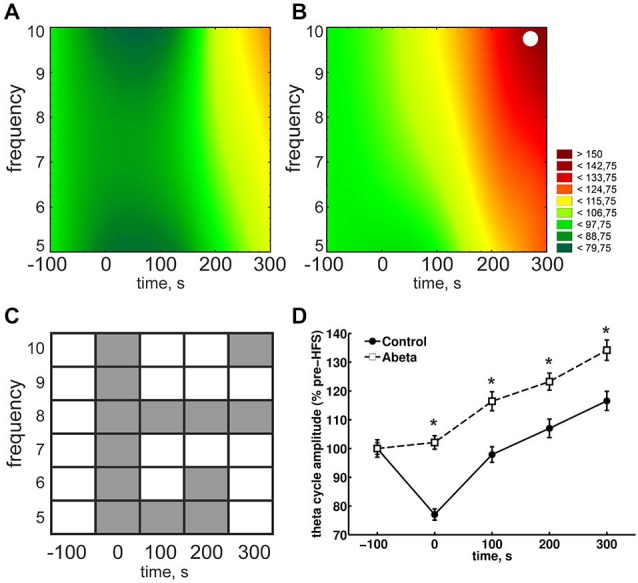
Overview of relative theta amplitudes at frequencies from 5–10 Hz for control and Aβ-treated animals. (A,B) The results for peak-to-slope amplitudes of cosine-phase theta cycles, normalized to baseline for control (A) and Aβ-treated animals (B) are shown. The color scale represents percent to the mean baseline values in (A,B). The results for peak-to-slope amplitudes for control group (A) show that during HFS, a suppression of theta amplitudes for almost all displayed frequencies can be seen. This does not appear in Aβ-group (B). However within-group statistical analysis revealed that the suppression in the control group is not significant for single theta cycle frequencies (White dots in (A) and (B) reflect significant different values compared to baseline according to Kruskal-Wallis-Test with Bonferroni corrected Tukey-based post hoc analysis for within group analysis). (C,D) The gray marks in the table (C) represent significant differences (according to the Bonferroni-corrected Wilcoxon test) in relative theta amplitude levels at different time-points and frequencies between control (A) and Aβ-treated animals (B). White marks indicate an absence of significant difference. The color scale represents percent to the mean pre-HFS value in (A,B). The suppression of theta cycle amplitudes during HFS of control, but not Aβ-treated animals animals is also expressed in the pooled frequencies (D). Values in the graphs are expressed as the mean ± standard error of the mean (SEM).
