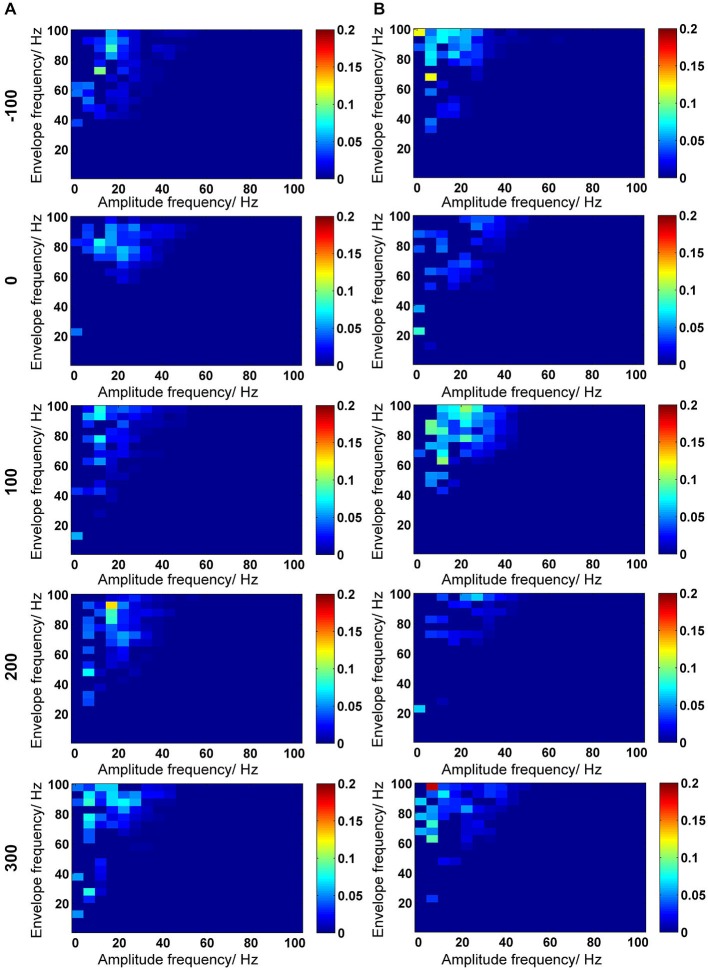
Figure 6.
Inter-frequency phase-to-amplitude coupling (PAC) quantified by envelope-to-signal correlation (ESC). (A,B) PAC-ESC scores for control animals (A) and for Aβ-treated animals (B). The time-line for EEG time-windows that were analyzed are shown at the left-side of the figure (see also Figure 2). The PAC-ESC scores were pooled from 10 measurements of 4.1 s epochs in 100 s time windows. The raw EEG was binned into center frequencies from 3–98 Hz ± 2 Hz resulting in 20 bins with 5 Hz frequency range. The y-axis reflects the envelopes of the binned signal whereas the x-axis reflects the frequencies of the signal amplitudes. The PAC-ESC scores, resulting from comparison of envelopes and amplitudes at binned frequencies, are expresses on the color scale for each plot. The probability that envelopes of a fast signals are fitting to the shape of amplitudes from slower signals is higher. For this reason, the highest PAC-ESC scores can be observed at the top left of each single plot. This relationship keeps stable for control and Aβ-animals for all time points (A,B). Particularly the PAC-ESC scores for frequencies in the range of theta to beta, and high gamma oscillations are prominent during the whole 500 s of analyzed EEG. However from this analytical perspective no clear differences between controls and Aβ-treated animals can be observed.

