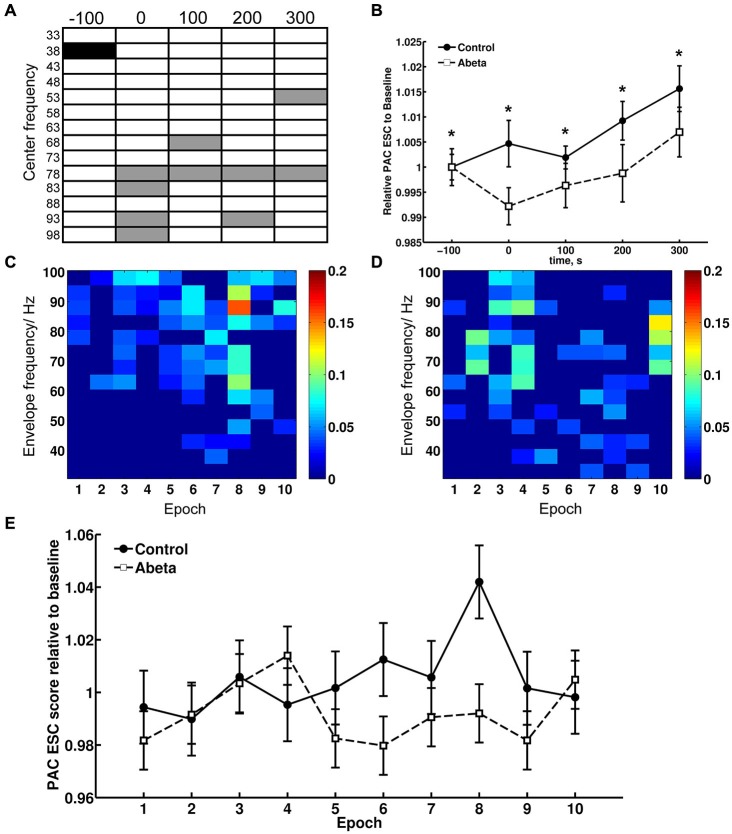
Figure 7.
Theta-gamma coupling estimated with PAC–ESC for control and Aβ-group. To estimate the effects of Aβ-treatment on theta-gamma coupling in terms of envelope-to-signal correlations, the PAC-ESC scores in range of theta and gamma oscillation were extracted from the whole PAC-ESC analysis (see Figure 6). All plots in Figure 7 show coupling scores solely for theta and gamma oscillations. A within-group statistical comparison of normalized PAC-ESC scores from control group and Aβ-group animals (B), revealed a significant effect over time on PAC-ESC scores compared to baseline only for Aβ-treated animals (Kruskal-Wallis test: p < 0.01). However a Bonferroni-corrected Tukey-based post hoc analysis revealed no significant PAC-ESC scores compared to baseline for both groups. A between-group comparison revealed significantly lower values Aβ-treated animals (Bonferroni-corrected Wilcoxon test: *p < 0.005) for all time-points. This observation on the pooled binned gamma envelopes is however undermined by the significant difference in baselines of control and Aβ-treated animals. Nonetheless, not all gamma center-frequencies show significant variations in baseline (A). Black-marked center-frequencies in table (A) show significantly variant baselines. Gray-marked center-frequencies show significant differences at the respective center-frequencies between control and Aβ-animals (Bonferroni-corrected Wilcoxon test: p < 0.00071). The effect of lower PAC-ESC scores during HFS for Aβ-animals (B), clearly results from lower envelope-to-signal correlations at high gamma center-frequencies. This can also observed by eye if one compares the PAC-ESC scores of control and Aβ-group during single epochs of HFS application (C,D). In addition, the pooled data obtained during single epochs of HFS application (E) reflect an increase in envelope-to-signal correlations relative to time in control animals. This cannot be observed for the Aβ-group. Graphs in (B,D) are expressed as Mean ± SEM.

