
Figure 1. Behavioral task and performance.
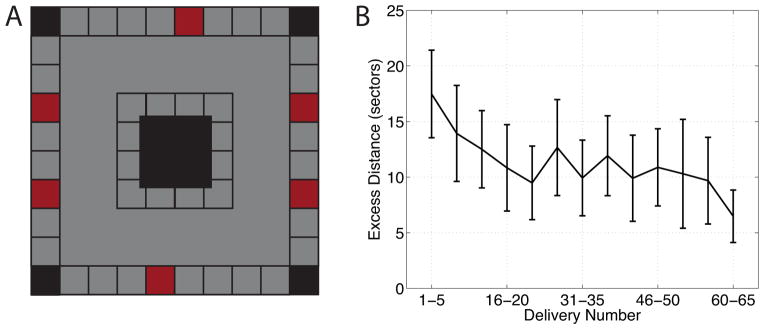
(A) An overhead schematic of the layout of the virtual environment. Red squares represent locations of the destination stores and white square are non-store buildings. Gray shading indicates regions of the environment where the patient could travel. (B) Subject average task performance as a function of delivery trial number. Performance is measured as the excess number of sectors traveled when searching for a destination store, compared to an ideal path. Error bars are 95% confidence intervals. See also Figure S1.