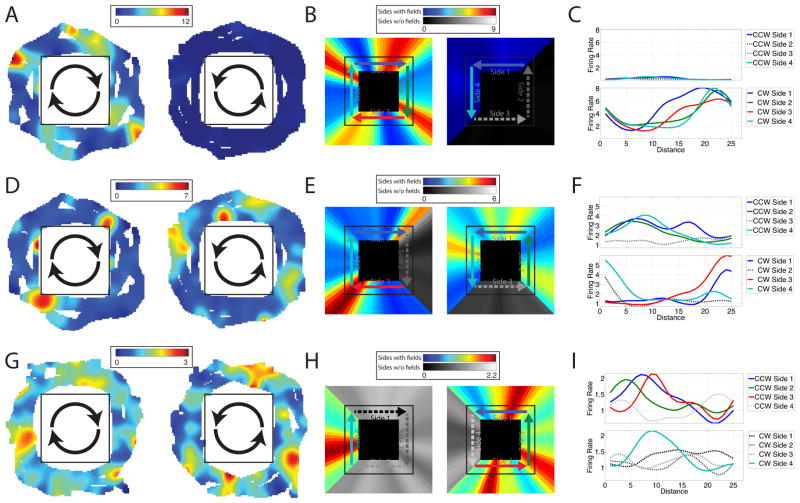
Figure 2. Path equivalent cell firing rate maps.
Top Row: Activity of a cell in patient 2’s entorhinal cortex. (A) Two dimensional firing rate map for epochs of clockwise (left) and counterclockwise (right) movement. (B) Linearized firing rate maps (smoothed with a 12-pt window) for epochs of clockwise (left) and counterclockwise (right) movement. Sides with regions of significantly elevated firing are shown in color, and sides without significant activations are in grayscale. (C) Firing rate as a function of distance from the beginning of the side, plotted separately for each side of the environment and for clockwise (bottom) and counterclockwise (top) directions. Middle Row: Activity of a cell in patient 2’s entorhinal cortex. Bottom Row: Activity of a cell in patient 5’s cingulate cortex. See also Figure S2.

