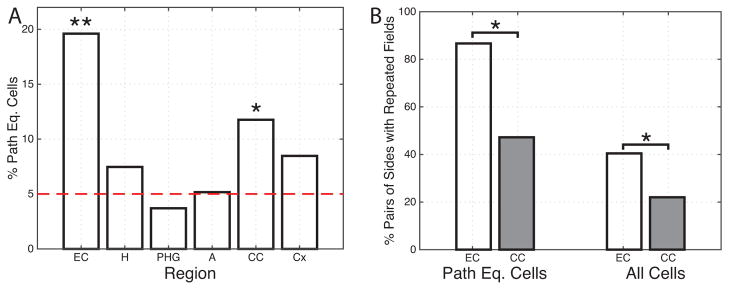
Figure 4. Population measurements.

(A) Regional distribution of path-equivalent cells, which are location-responsive cells that have correlated responses across multiple corridors in the environment. EC: entorhinal cortex; H: hippocampus; PHG: parahippocampal gyrus; A: amygdala; CC: cingulate cortex; Cx: frontal/lateral-temporal cortex. (B) The percent of corridor pairs with place fields at the same relative locations. This measure is computed by identifying each cell with place fields on at least two corridors and measuring, across all pairs of corridors, how often place fields occur at the same relative location. ** denotes p<.0001, * denotes p<.05. See also Figure S4 and Table S1.
