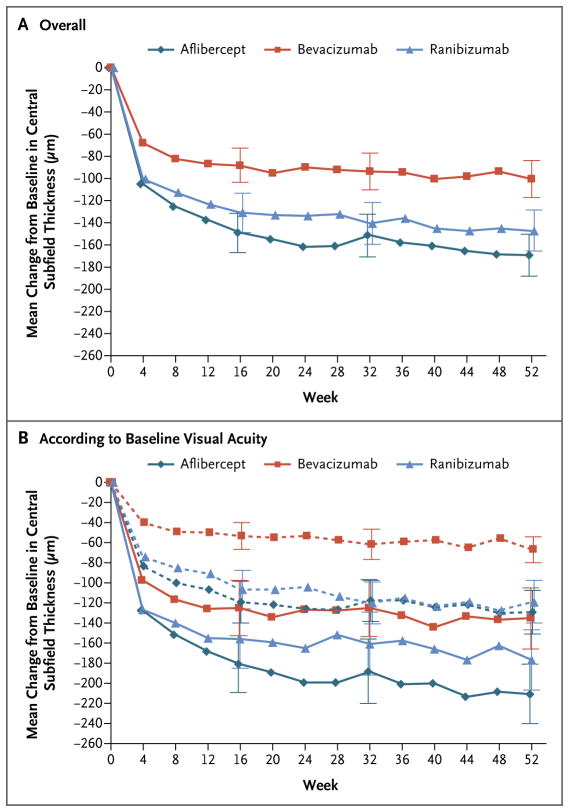
Figure 2. Mean Change in Central Subfield Thickness over Time.
Shown are the changes in central subfield thickness overall (Panel A) and according to baseline visual acuity (Panel B). In Panel B, solid lines indicate baseline visual acuity of 20/50 or worse, and dashed lines indicate baseline visual acuity of 20/32 to 20/40. Central subfield thickness was assessed with the use of optical coherence tomography. The number of eyes assessed at each 4-week interval ranged from 192 to 221 in the aflibercept group, 186 to 216 in the bevacizumab group, and 185 to 215 in the ranibizumab group. I bars indicate 95% confidence intervals.

