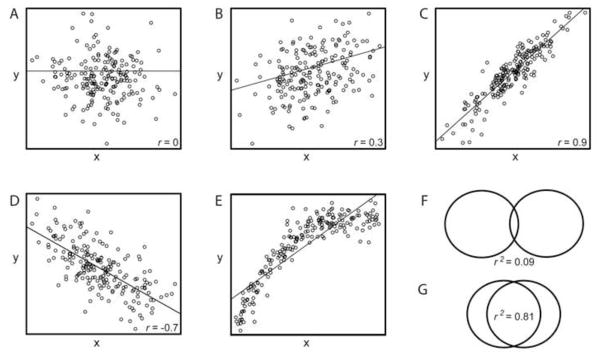
Figure 5.

Examples of scatterplots. The overlaying line is from simple linear regression of y on x. The variables x and y are independent. A. Pearson’s correlation coefficient (r) =0. B–D reveal linear relationships. Both B and C reveal positive correlations, whereas D reveals a negative correlation. E. Because the scatterplot reveals a non-linear monotonic relationship, the non-parametric Spearman’s correlation is appropriate in this example. F–G. The coefficient of determination (r2) is illustrated by the overlapping area of the two circles; this illustrates the proportion of variance explained by the other variable. (e.g. Scatterplot B (r=0.3) is to r2=0.09 (F); Scatterplot C (r=0.9) is to G r2=0.81).
