
Figure 3.
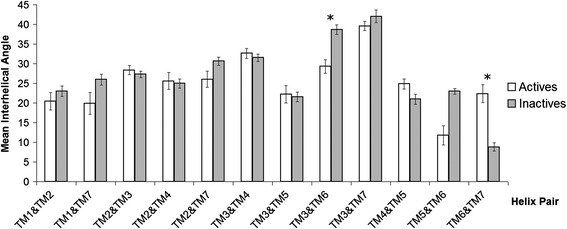
Average interhelical angles extracted from 18 inactive and 7 active class A GPCR structures. Standard error bars are shown. *denotes statistical significance between inactive and active states with Student’s t-test after Bonferroni correction for multiple testing.