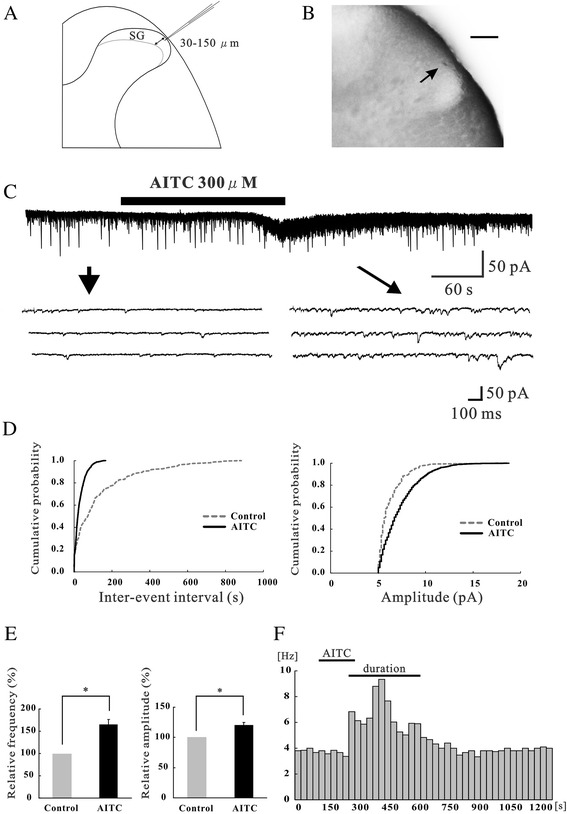
Figure 1.

Identification of SG neurons and the action of AITC on excitatory synaptic transmission in SG neurons. (A) Schematic drawing of the transverse spinal cord slice and of a recording electrode. Recordings were made from cells at a depth of 30 – 150 μm (shown by arrows) from the surface of the spinal cord. (B) Transverse slices of the spinal cord at the level of L5. A recorded cell was identified with an intracellular injection with neurobiotin (shown by an arrow). After recording synaptic responses, the spinal cord was fixed and then cut into 500 μm thick slices. Scale bar is 100 μm. (C) Continuous chart recording of glutamatergic EPSCs before and during the action of AITC (300 μM; top). Three consecutive traces of EPSCs are shown in an expanded scale in time, before (bottom left) and under the action of AITC (bottom right). Note, a slow inward current that is accompanied by increases in EPSC frequency and amplitude (top). (D) Cumulative distribution of the inter-event interval (left) and amplitude (right) of EPSCs in control (dotted line) and during (continuous line) the action of AITC. AITC shifted the inter-event interval and amplitude to a shorter and a larger one (same neuron as in Figure 1C). (E) Summary of EPSC frequency (left) and amplitude (right) under the action of AITC (n = 68) relative to control. In this and subsequent figures, vertical or horizontal lines accompanied by bars indicate S.E.M. Statistical significance between data is indicated by an asterisk; *P < 0.05. (F) The frequency of EPSCs following the application of AITC plotted against time. Each bar indicates data calculated from the EPSCs measured for 30 s (same neuron as in Figure 1C). “Duration” represents the period when the frequency increases more than 20% of the control.
