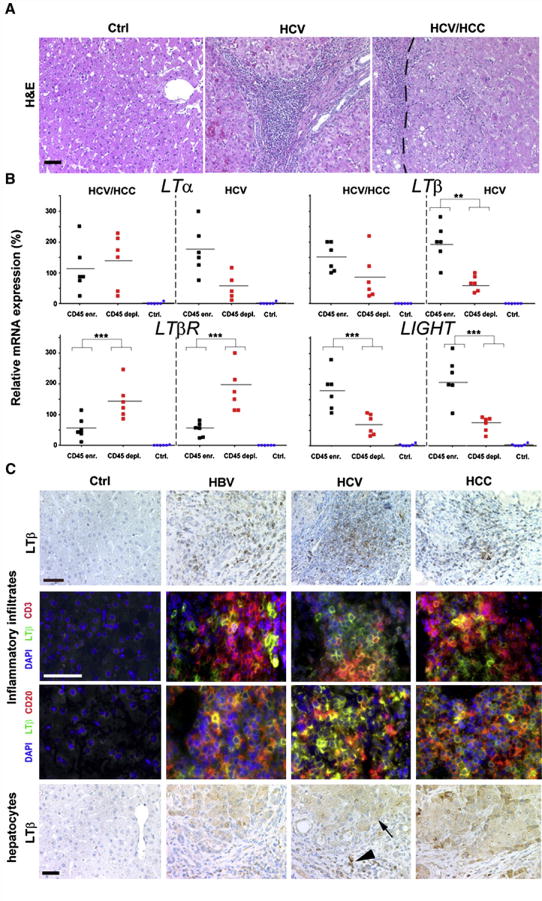
Figure 2. Identification of cell types expressing TNF-superfamily members in virus-infected or HCC-affected livers.
(A) Histology of representative paraffin sections of healthy controls, HCV-infected livers, and HCC with HCV etiology. HCV-infected livers (HCV) and tumors (HCV/HCC) display leukocytic infiltrates. H&E: Hematoxylin and eosin staining. The tumor border is indicated by a dashed line (scale bar: 100μm). (B) Real-time PCR analysis of sorted, CD45-enriched or CD45-depleted liver cells. For control, whole liver cell populations derived from healthy or diseased livers (HCV infected/HCC) were used. mRNA expression levels are normalized to unsorted, total cell populations of the respective liver disease and calculated as 100%. The average expression level is indicated as percentage of control (unsorted cells of the respective disease) and demarcated by horizontal bars. *, **, *** indicate statistical significance (Student’s T-test): * = p≤0.05; ** = p<0.001; *** = p<0.0001. (C) Immunohistochemical (upper and lower panel) and immunofluorescence analysis for LTβ expression in healthy, HBV- or HCV-infected and HCC-affected livers (scale bar: 50μm). Arrowhead depicts LTβ+ leukocytes, arrow LTβ+ hepatocytes.

