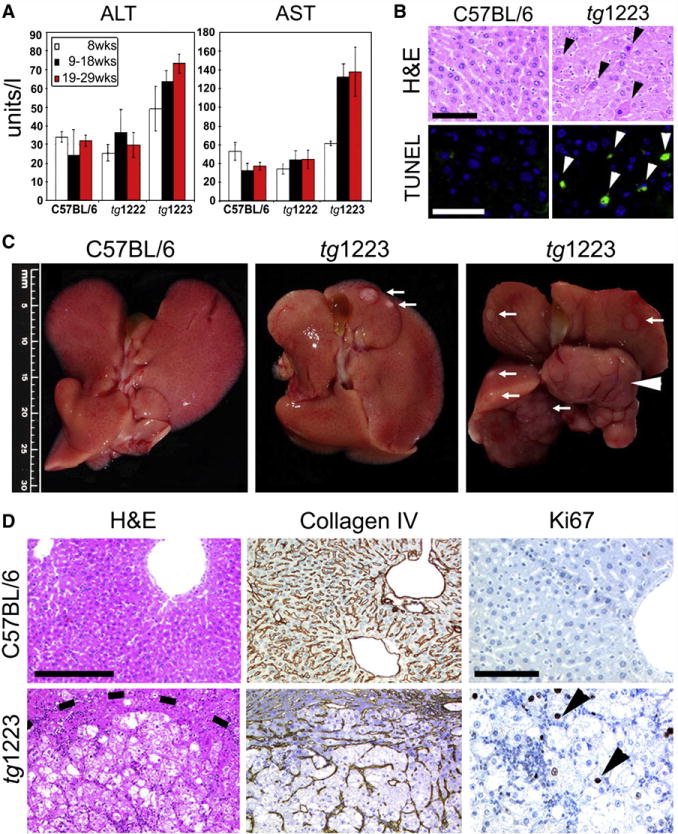
Figure 4. Chronic liver injury and HCC development in tg1223 mice.
(A) Significant elevation of transaminases (ALT, AST) in sera of tg1223 mice from 19 weeks of age. Standard deviation (+/− SD) is indicated by error bars. (B) Increased hepatocyte cell death in tg1223 livers documented by H&E staining and TUNEL/DAPI assay. H&E: Hematoxylin & eosin: Black arrowheads indicate apoptotic hepatocytes. TUNEL: Green TUNEL+ hepatocyte nuclei indicate apoptosis (white arrowheads; scale bars: 50μm). (C) Macroscopy of C57BL/6 (left panel) and tg1223 livers at the age of 12 (middle panel) and 18 months (right panel). White arrows indicate tumor nodules. White arrowhead indicates a liver lobe completely affected by HCC. Scale bar size is indicated. (D) Histological analysis of livers derived from C57BL/6 and tg1223 mice. Dashed line depicts the HCC border. Collagen IV staining highlights the broadening of the liver cell cords and loss of collagen IV networks indicative of HCC in tg1223 mice (scale bar: 200μm). High numbers of Ki67+ proliferating hepatocytes (arrowheads) are only found in tg1223 HCC (right column; scale bar: 100μm).

