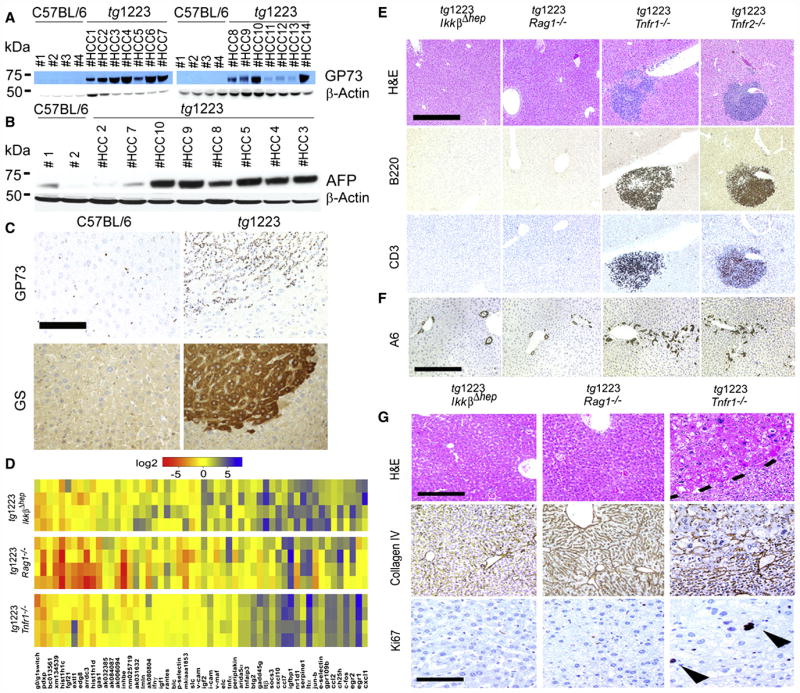
Figure 7. Expression of tumor markers in tg1223 HCC and mechanistic characterization of liver carcinogenesis in tg1223 mice.
(A) Immunoblot analysis of C57BL/6 and tg1223 HCC homogenates for GP73. Strong to moderate signal intensities were detected in all tg1223 HCC, but not in C57BL/6 livers. (B) Immunoblot analysis of C57BL/6 and tg1223 HCC homogenates for AFP. β-Actin served as a loading control (kDa: kilo Dalton). (C) Immunohistochemistry for GP73 and GS in a representative tg1223 HCC and age-matched C57BL/6 control (scale bar: 100μm). (D) mRNA expression of candidate genes in livers of 3 month-old tg1223/IkkβΔhep, tg1223/Rag1−/− and tg1223/Tnfr1−/− mice. Data are presented in a log 2 scale (blue: upregulated; red: downregulated). Rows indicate individual mice; columns represent particular genes. Each data point reflects the median expression of a particular gene resulting from 3–4 technical replicates, normalized to the mean expression value of the respective gene in C57BL/6 livers. (E) Histological analysis of tg1223/IkkβΔhep, tg1223/Rag1−/−, tg1223/Tnfr1−/−, and tg1223/Tnfr2−/− livers at 9 months of age. H&E, B220 for B-cells, CD3 for T-cells (scale bar: 500μm). (F) Immunohistochemical analysis of A6+ cells (oval cells) in livers of tg1223/IkkβΔhep, tg1223/Rag1−/−, tg1223/Tnfr1−/−, and tg1223/Tnfr2−/− mice at 9 months of age (scale bar: 500μm). (G) Immunohistochemical analysis of tg1223/IkkβΔhep, tg1223/Rag1−/−, and tg1223/Tnfr1−/− livers (18 months of age). Dashed line depicts the HCC border (upper row; scale bar: 200μm). Collagen IV staining highlights the broadening of liver cell cords and loss of collagen IV networks in tg1223/Tnfr1−/− HCC. Ki67+-proliferating hepatocytes are indicated by arrowheads (lower row; scale bar: 50 μm).

