
Figure 4.
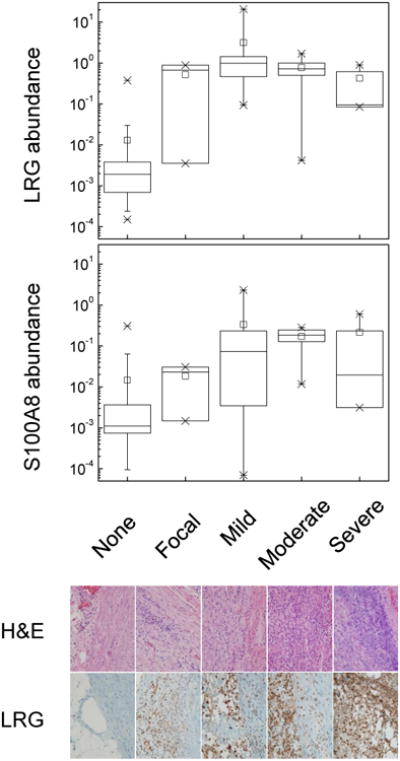
Top panel. Boxplots of the relative urine protein abundance (normalized ion current units) of leucine-rich α-2-glycoprotein (LRG) and calgranulin A (S100-A8) as a function of appendicitis severity, as assessed using histologic classification. Crosses represent 1-99 % range. Note that the group with histologically normal appendices includes both patients who underwent appendectomies and patients without clinical diagnosis of appendicitis. Bottom panel. Representative micrographs of appendectomy specimens and immunohistochemistry staining against LRG.