
Figure 3.
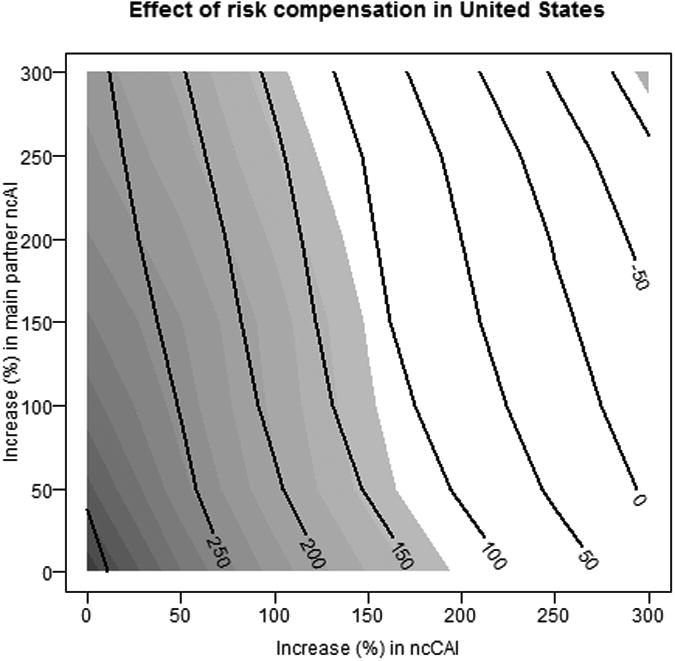
Effects of risk compensation on cases averted in the United States. Contour lines represent the expected percent change in the number of new infections, while the shading indicate the strength of evidence for the effect.
Official websites use .gov
A
.gov website belongs to an official
government organization in the United States.
Secure .gov websites use HTTPS
A lock (
) or https:// means you've safely
connected to the .gov website. Share sensitive
information only on official, secure websites.
Effects of risk compensation on cases averted in the United States. Contour lines represent the expected percent change in the number of new infections, while the shading indicate the strength of evidence for the effect.