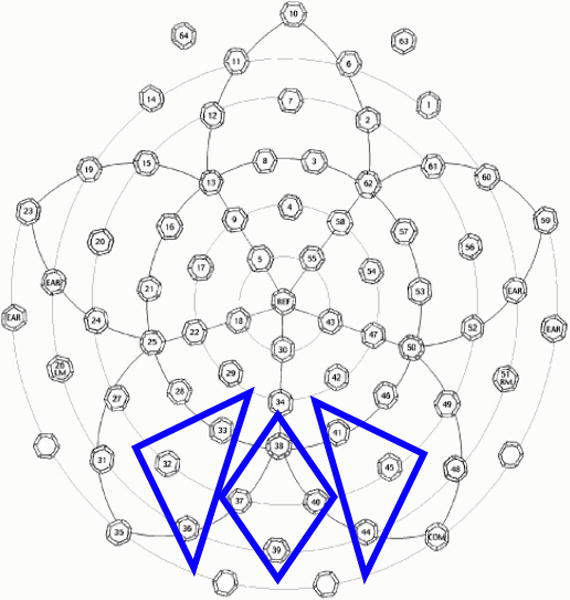
Figure 2. Sensor selection for other-race analysis.

The N290 and the P400 were measured over the left, middle, and right groups of electrodes outlined in blue (the top of the array is the front of the head, the bottom is the back). The signal at each electrode was averaged across trials and across sensors within a group to yield an average waveform for each subject.
