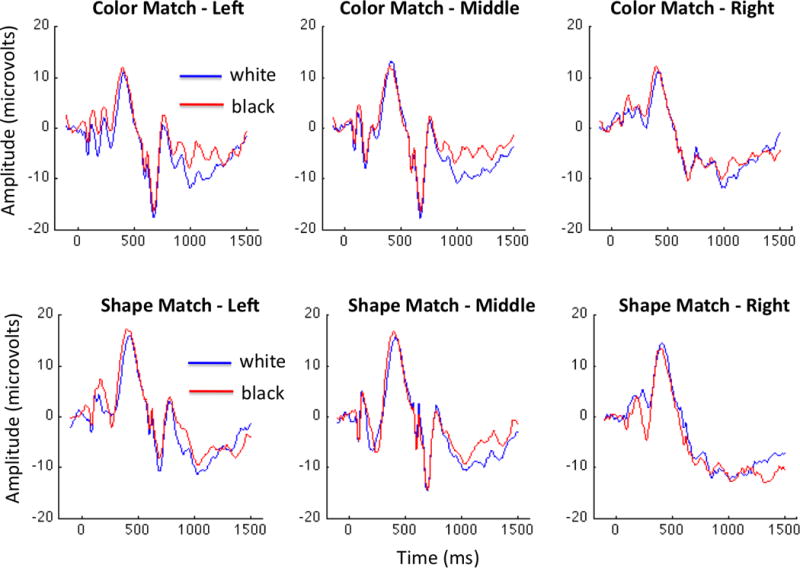
Figure 4. Shape- and color-matched ERP results.

Average ERPs over the left, middle, and right electrode groups in the color-matched (top row) and shape-matched (bottom row) groups are presented here. We found no main effect of race in either group, but significant effects of region in both cases (favoring middle electrodes over left). The shape-matched group also yielded an interaction between race and region, which was due to region effects that were only evident for Black faces. Post-hoc tests revealed no significant effects of race within any region (including the apparent difference in the right sensor group).
