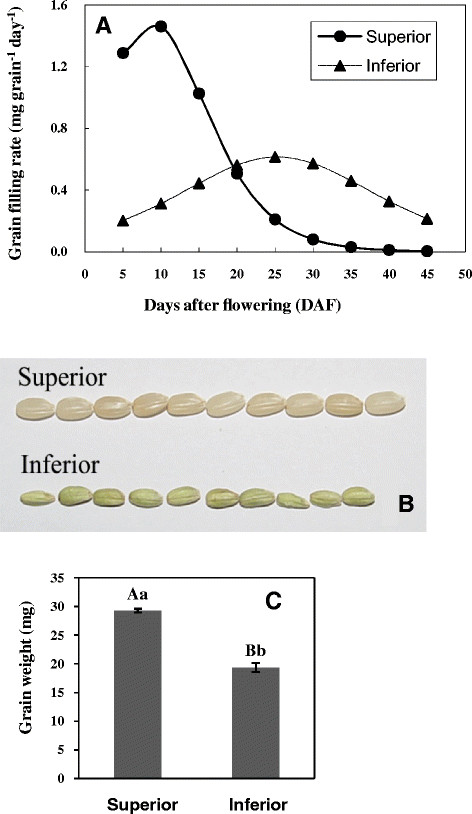
Figure 1.

The differences between superior and inferior spikelets by grain filling rate, grain appearance, and the grain weight in rice. (A). A line chart showing the grain filling rate difference between superior and inferior spikelets at different days after flowering (DAF) during rice grain filling. Grain filling rate was calculated by regression analysis using Logistic equation from the average of five repeats of the grain weight as described in Method. (B). Distinct appearance and comparison of grains in superior and inferior spikelets of brown rice. Grain size and plumpness can be visually compared in this figure. (C). Bar graph showing the statistical comparison of the final grain weight between superior and inferior spikelets. Equal amount of grains from triplicate lines were used for this measurement and error bar represented the standard errors of the means. Student two-tailed t test was used for statistical analysis of the difference; Aa and Bb indicate that the difference is of dramatic significance.
