
Figure 1.
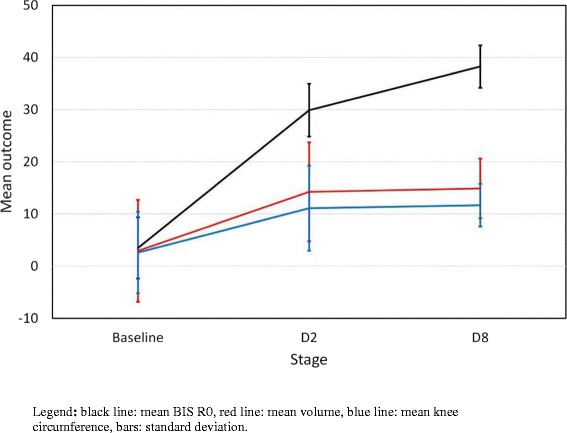
Comparison of swelling evolution according to the measurement method. Legend: black line: mean BIS R0, red’ line: mean volume, blue line: mean knee circumference, bars: standard deviation.
Official websites use .gov
A
.gov website belongs to an official
government organization in the United States.
Secure .gov websites use HTTPS
A lock (
) or https:// means you've safely
connected to the .gov website. Share sensitive
information only on official, secure websites.
Comparison of swelling evolution according to the measurement method. Legend: black line: mean BIS R0, red’ line: mean volume, blue line: mean knee circumference, bars: standard deviation.