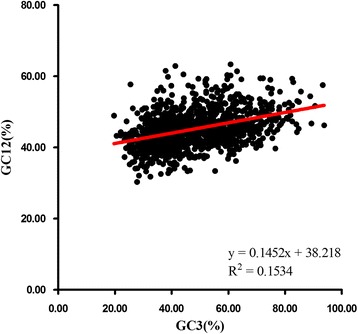
Figure 6.

Neutrality plot analysis of the GC12 and that of the third codon position (GC3) for the entire coding DNA sequence of Bombyx mori. GC12 stands for the average value of GC content in the first and second position of the codons (GC1 and GC2). While GC3 refers to the GC content in the third position. The solid line is the linear regression of GC12 against GC3, R2=0.1534, P < 0.001.
