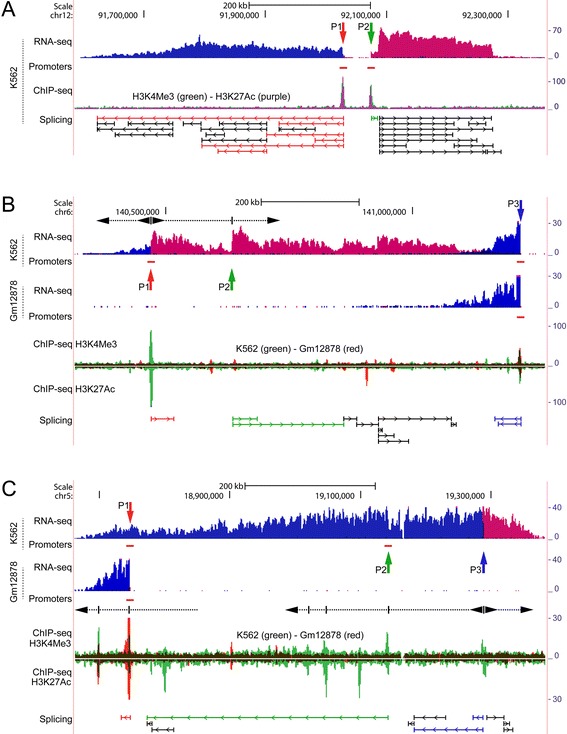
Figure 1.

ERVs sustain complex and cooperative regulation of megabase-sized regions that are not annotated. RNA-seq coverages are shown as strand-specific BedGraphs [19]. Alignment to the positive and negative strands is colored red and blue, respectively. Horizontal red bars below the RNA-seq panels indicate positions of active promoters (not to scale), predicted from ChIP-seq by hidden Markov model (ENCODE/Broad). ChIP-seq peaks (ENCODE/Regulation) are colored according to subfigure legends. Right-hand axes show vertical viewing ranges of RNA-seq and ChIP-seq data. Vertical arrows, P1, P2 etc., indicate positions of ERVs and other repeats, and are colored according to linked (i.e. chimeric) RNA splice junctions of individual repeats. Splice junctions are from ENCODE/CSHL and ENCODE/Caltech. For simplicity only an excerpt is shown. Junctions in black are not linked to repeats in positions marked by vertical arrows. (A-C) Subfigures show cooperative transcription regulations of progressively increasing complexity in unannotated loci. (A) The ~700 kb locus is transcribed bidirectionally from separated sites, P1 and P2, containing ERV9-LTR12 and Alu repeats, respectively, and whose positions coincide with major ChIP-seq regulatory motifs representing promoters. (B) Transcription of the ~950 kb locus is sustained by ERVs and other repeats in positions P1-P3, including splicing from an Alu element positioned in P2. The position of P2 does not coincide with major ChIP-seq regulatory motifs in K562 cells, therefore the increase in transcription coverage at this position and chimeric splicing suggest contribution by an unknown mechanism. (C) The ~750 kb locus is regulated by three ERV9-LTR12s positioned in P1-P3. ChIP-seq enrichments at multiple positions suggest that coregulation by ERVs and non-LTR repeats may be more pervasive in some regions. In (B-C) the loci are differentially regulated in K562 and Gm12878 cells. Some hypothetical transcription patches are indicated (dashed arrows), based on increases in RNA-seq coverage and ChIP-seq enrichments. Close-ups in Figure 2.
