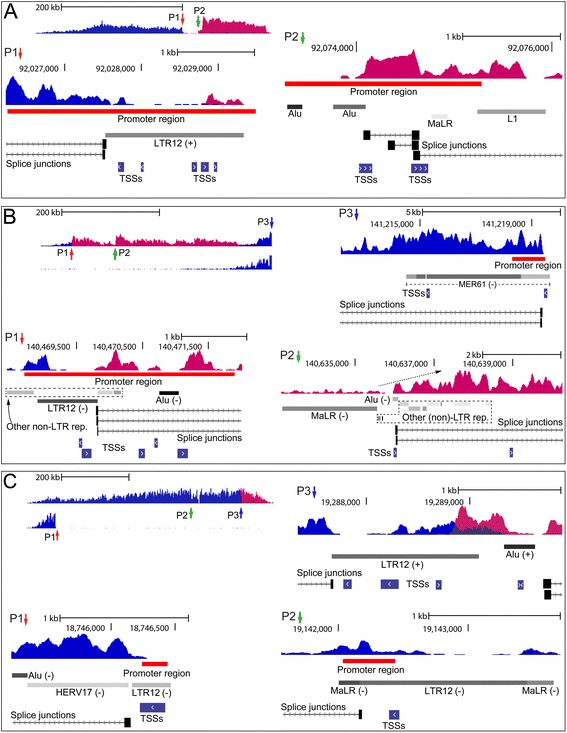
Figure 2.

Close-up views of regulatory regions in unannotated loci. The subfigures (A-C) show close-up views of the positions P1, P2 and so on, shown in Figure 1. The LTR and non-LTR repeat elements are from RepeatMasker and shadings reflect the confidence of annotation where darker is higher [21]. CAGE TSSs are from ENCODE/Riken. The orientation (+ or -) of select repeats is shown with respect to the positive genome strand, and for simplicity some elements are not shown in the subfigures. The promoter regions are drawn to scale and correspond to those shown in Figure 1 from ENCODE/Broad. Only an excerpt of splice junctions is shown. In subfigure B, P2 the increase in RNA-seq coverage, immediately downstream of the MaLR repeat, is indicated by a dashed arrow. The subfigures show close-up views of regulatory regions in K562 cells, except for B, P3 and C, P1 which show corresponding regions from Gm12878 cells.
