
Figure 4.
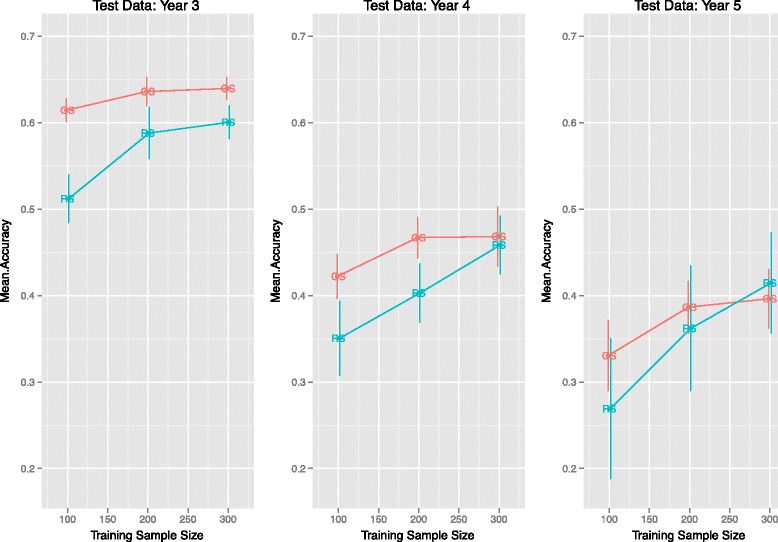
Wheat data. Comparisons of the mean accuracies (measured by correlation) when the test data set is selected from years 2007 through 2009 for different training sample sizes. For each of these cases, the training set was selected from the individuals in the years preceding the test year. Error bars at three standard error units are also included.