
Fig. 4.
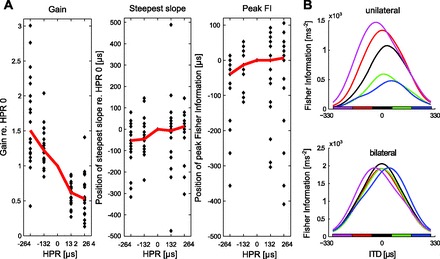
A: plots of neural gain (left), the position of the steepest slope (middle), and the position of peak FI (right) for 23 individual IC neurons for each HPR. Individual values are plotted with respect to the gain, position of steepest slope, and position of peak FI relative to that for the response to the zero-centered HPR. Red lines plot the median values. Some data points are outside the bounds of the plot, so that the median values can be clearly seen. B: summed FI for neurons in response to changes in the center of the HPR. Top: FI for all neurons in one IC. Bottom: mirrored FI, taking account of the contribution of both sides of the brain.